Fig. 2.
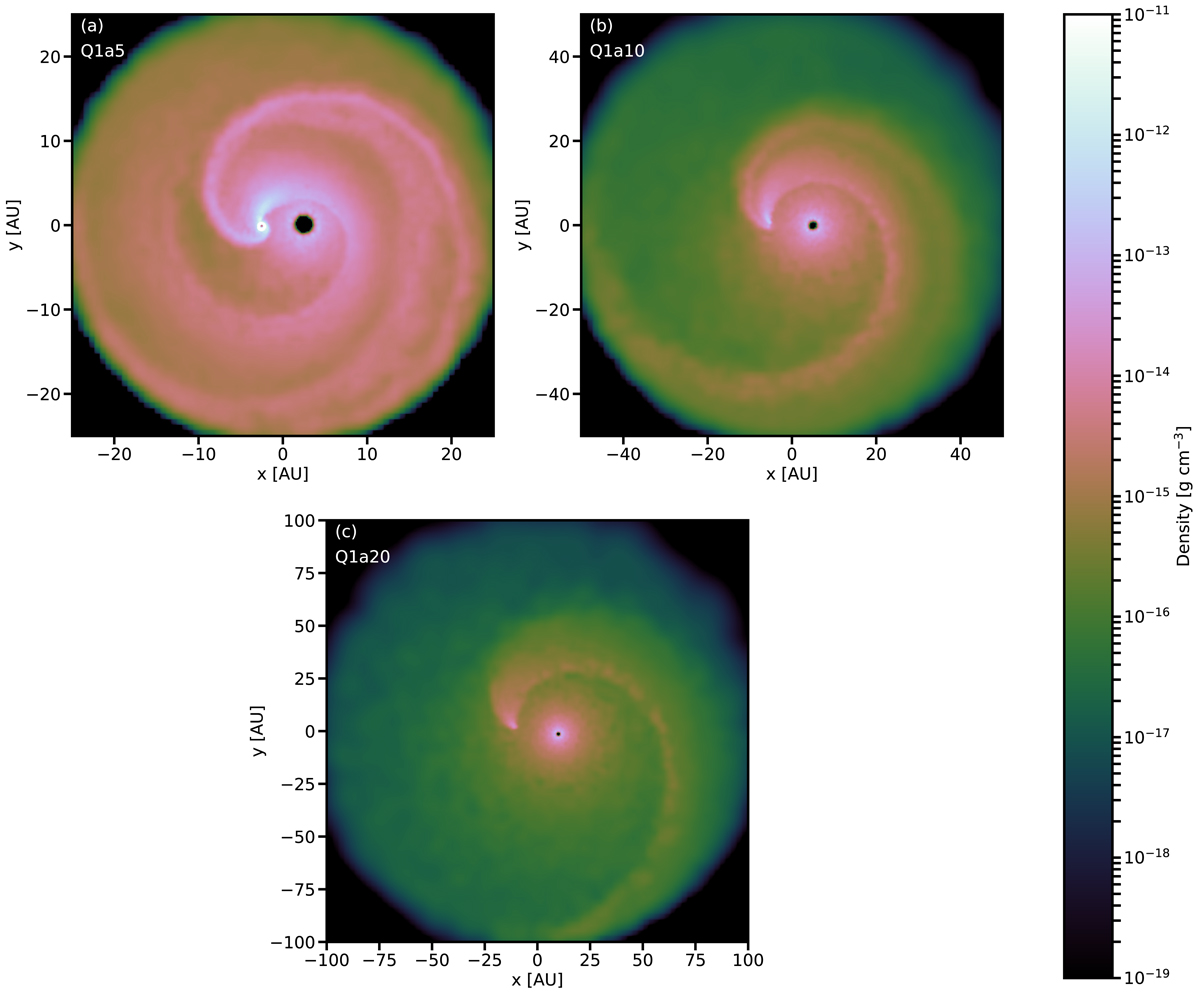
Gas density in the orbital plane for models Q1a5, Q1a10, and Q1a15 (same mass ratio, but different orbital separations). The companion star is located on the left and the AGB donor on the right. Each figure is scaled to display the full simulation, i.e. a sphere with radius equal to 5a, and shows the situation after 9.5 orbital periods.
Current usage metrics show cumulative count of Article Views (full-text article views including HTML views, PDF and ePub downloads, according to the available data) and Abstracts Views on Vision4Press platform.
Data correspond to usage on the plateform after 2015. The current usage metrics is available 48-96 hours after online publication and is updated daily on week days.
Initial download of the metrics may take a while.