Fig. 9.
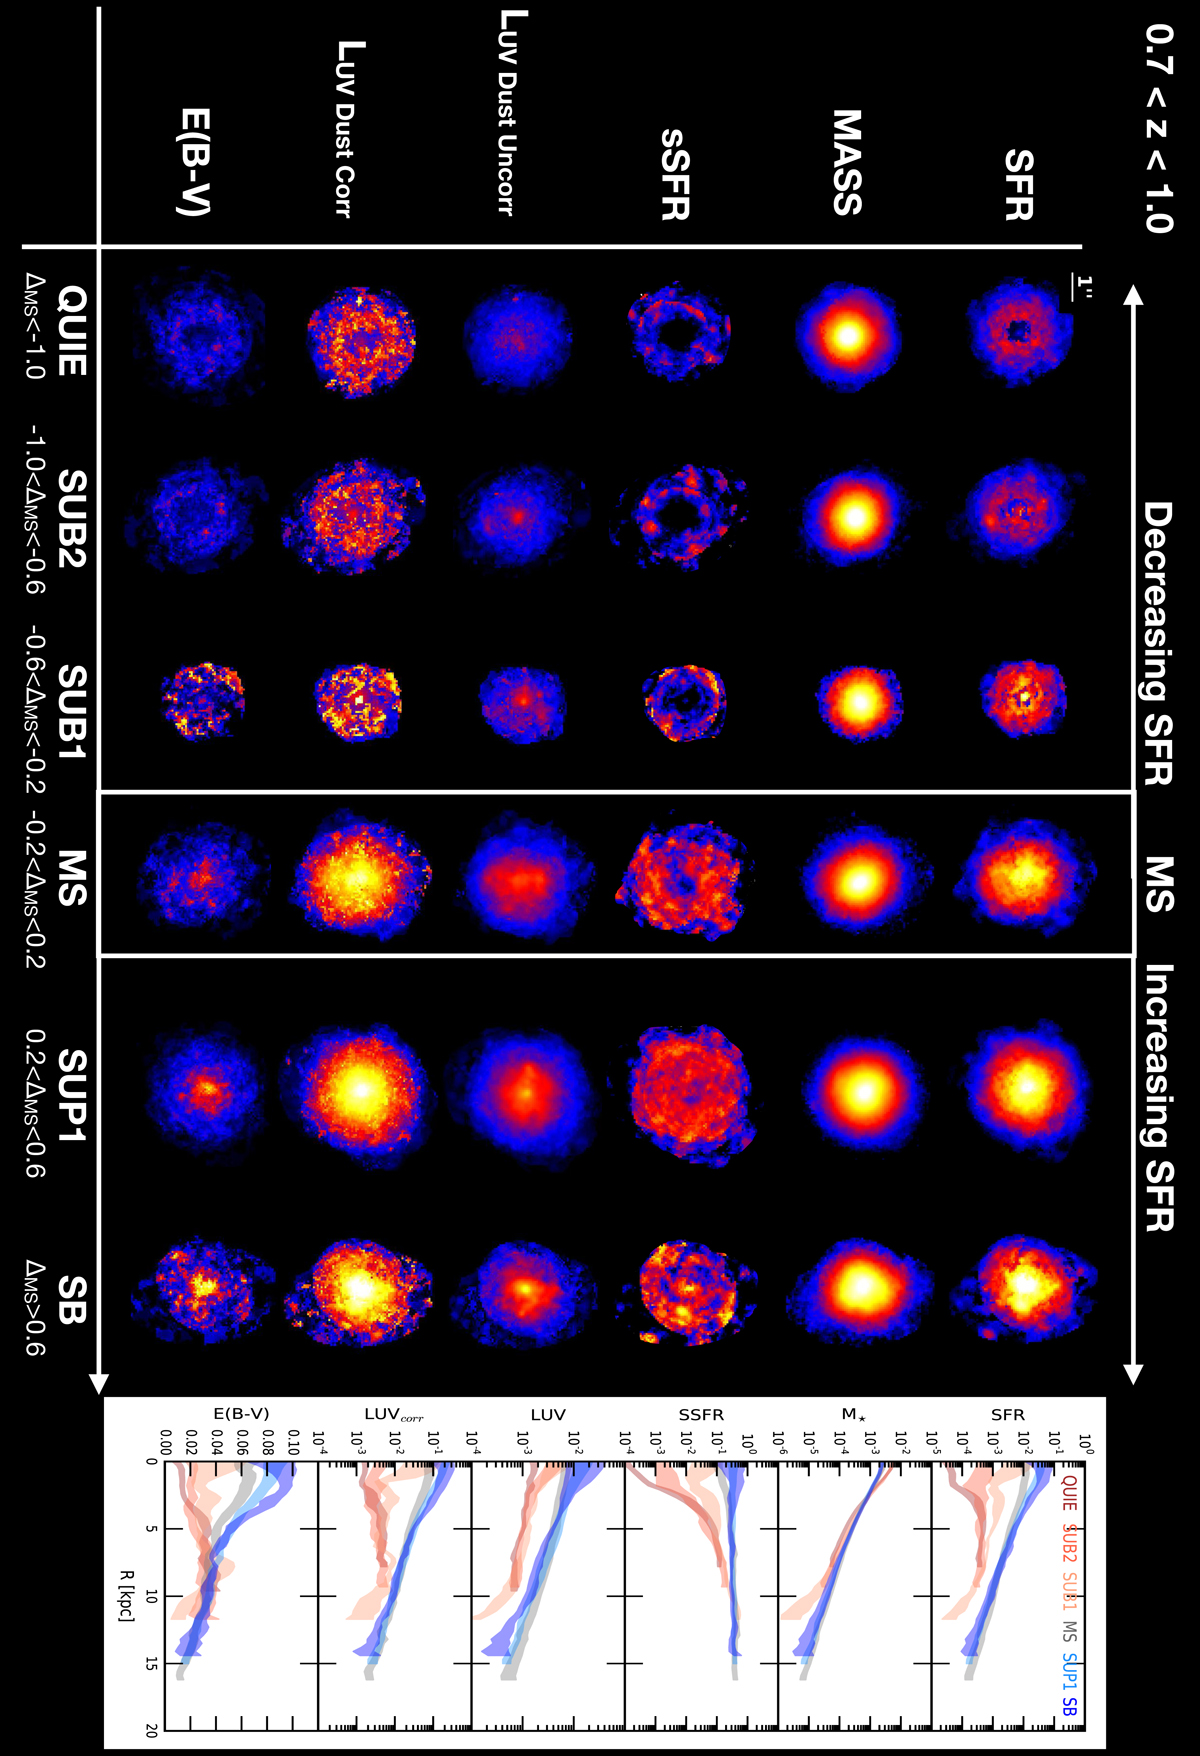
From top to bottom: stacked maps of SFR, stellar mass, sSFR, uncorrected LUV, dust corrected LUV, and E(B − V) of galaxies with axis ratio q > 0.5, 0.05″ < re < 0.8″, 0.7 < z < 1.0, and 10.0 < Log(M⋆/M⊙) < 10.5. The six columns are the six bins of distance from the MS. On the right side of the figure, the median radial profiles of galaxies in each bin are shown using the same colour code as Figs. 4 and 5. The trends shown in this figure hint towards inside-out quenching below the MS and enhanced SF activity above the MS.
Current usage metrics show cumulative count of Article Views (full-text article views including HTML views, PDF and ePub downloads, according to the available data) and Abstracts Views on Vision4Press platform.
Data correspond to usage on the plateform after 2015. The current usage metrics is available 48-96 hours after online publication and is updated daily on week days.
Initial download of the metrics may take a while.