Free Access
Fig. 6.
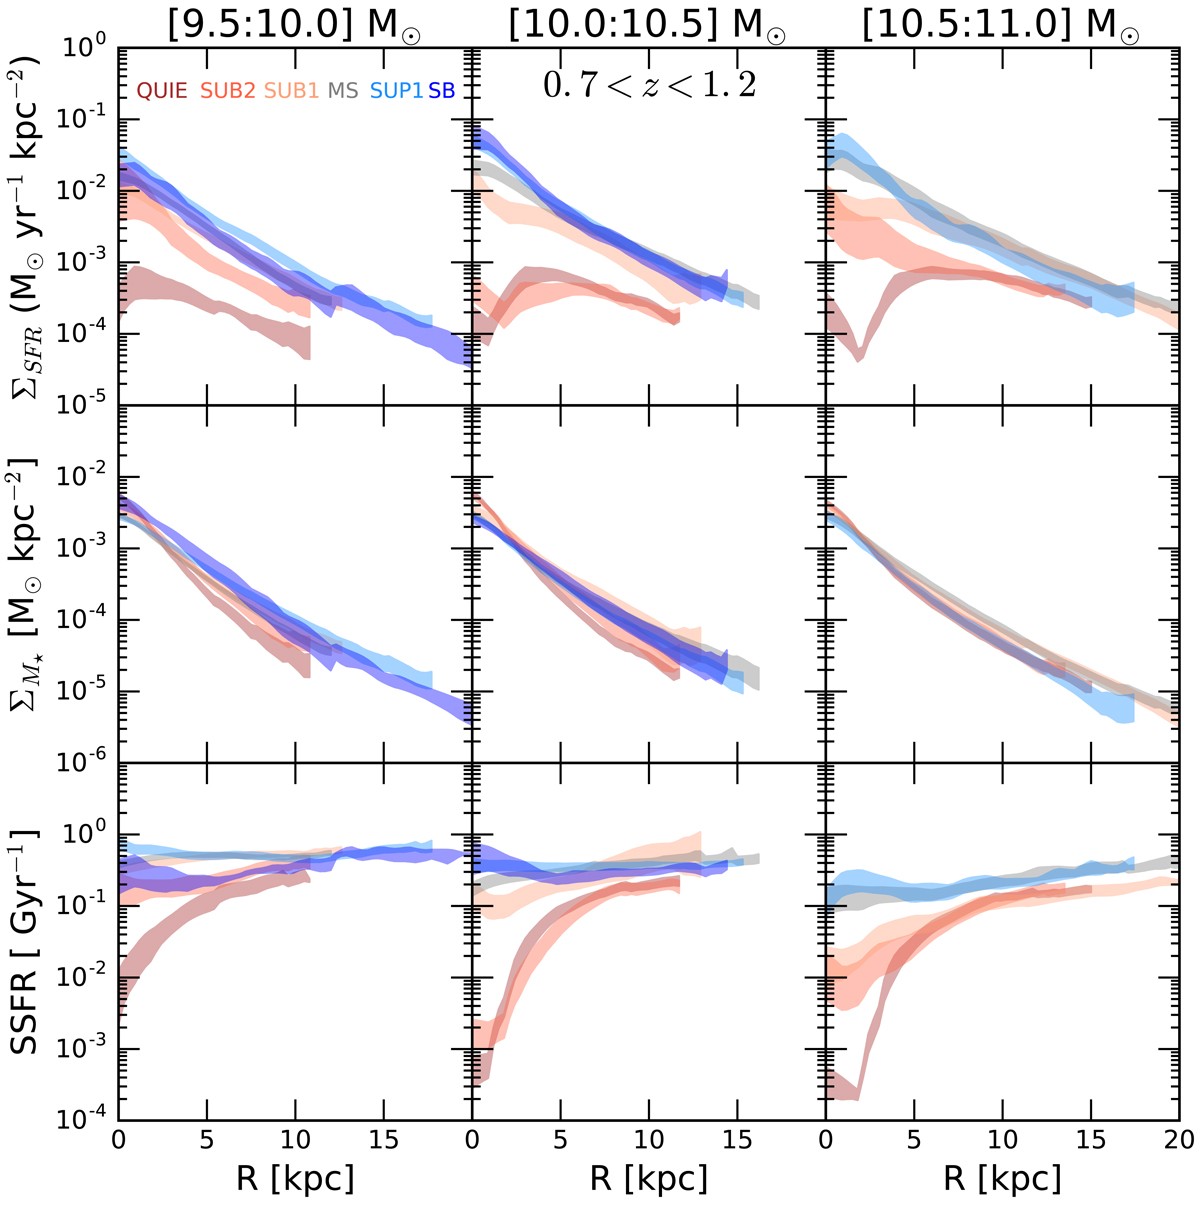
Same as Fig. 5, but for galaxies in the redshift range [0.7:1.2]. Also in the high-z sample we observe that the sSFR of galaxies below the MS is significantly lower in the central regions with respect to MS counterparts.
Current usage metrics show cumulative count of Article Views (full-text article views including HTML views, PDF and ePub downloads, according to the available data) and Abstracts Views on Vision4Press platform.
Data correspond to usage on the plateform after 2015. The current usage metrics is available 48-96 hours after online publication and is updated daily on week days.
Initial download of the metrics may take a while.