Fig. 5.
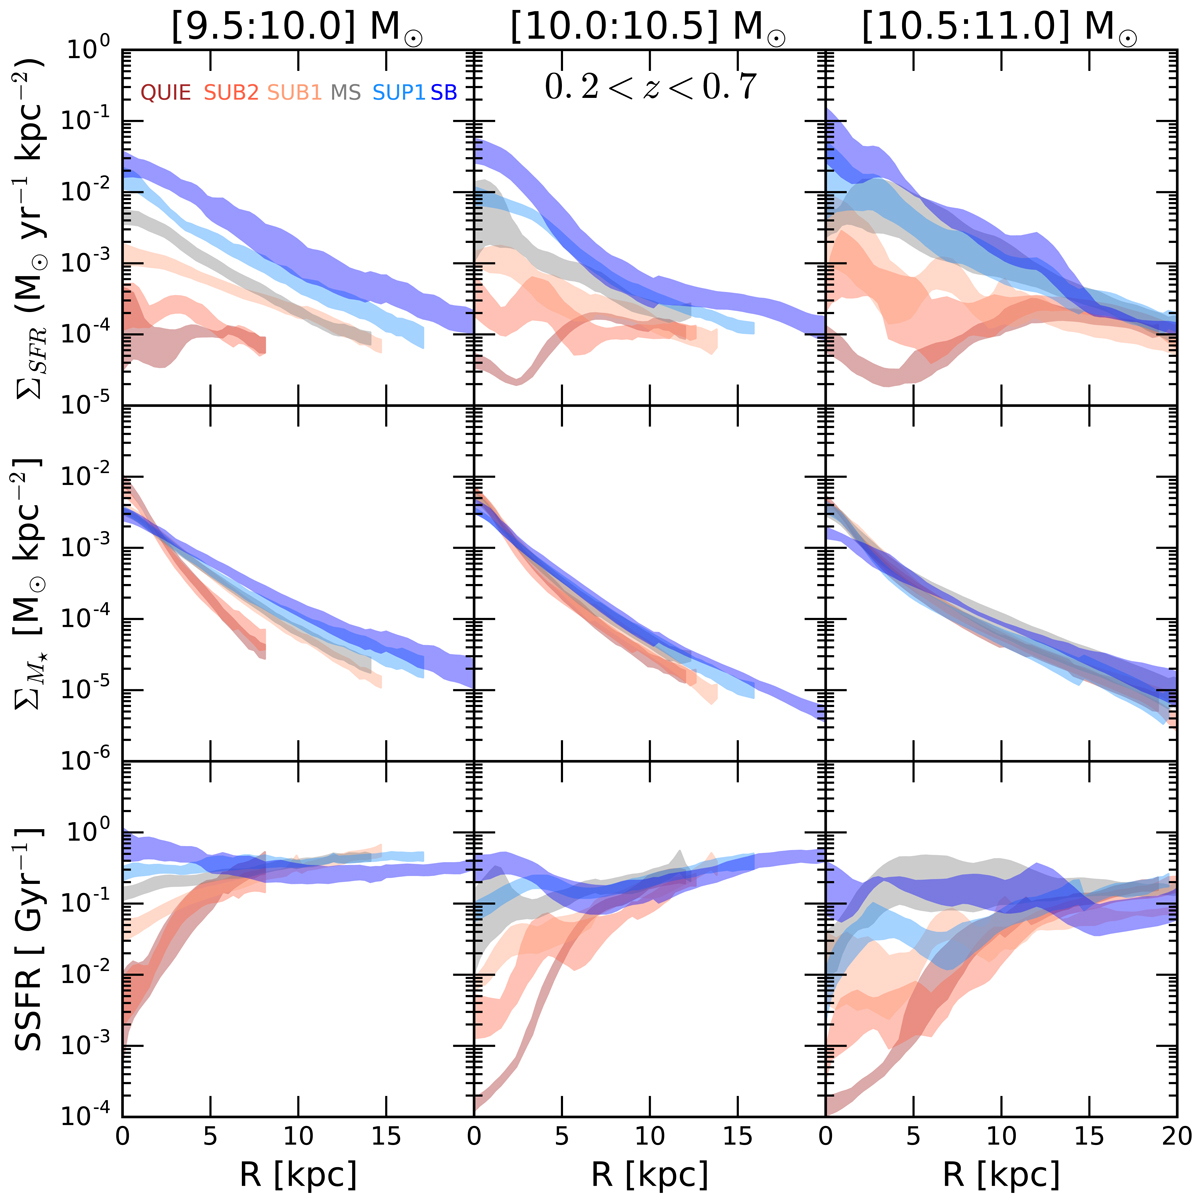
Median SFR (first row), stellar mass (second row), and sSFR (third row) surface densities as a function of distance from the centre (in kiloparsecs) for galaxies in the redshift range [0.2:0.7]. The three columns indicate galaxies with different stellar masses: 9.5 < Log(M⋆/M⊙) < 10.0 in the first, 10.0 < Log(M⋆/M⊙) < 10.5 in the second, and 10.5 < Log(M⋆/M⊙) < 11.0 in the third column, respectively. The thickness of the profiles in a given bin of distance from the centre is given by ± the standard deviation of the values in that bin, dived by the square root of the number of points in that bin. Different colours mark different bins of distance from the MS, as defined in Fig. 4. The sSFR profiles of galaxies below the MS are characterised by a central suppression that becomes more significant with increasing distance from the MS.
Current usage metrics show cumulative count of Article Views (full-text article views including HTML views, PDF and ePub downloads, according to the available data) and Abstracts Views on Vision4Press platform.
Data correspond to usage on the plateform after 2015. The current usage metrics is available 48-96 hours after online publication and is updated daily on week days.
Initial download of the metrics may take a while.