Fig. 4.
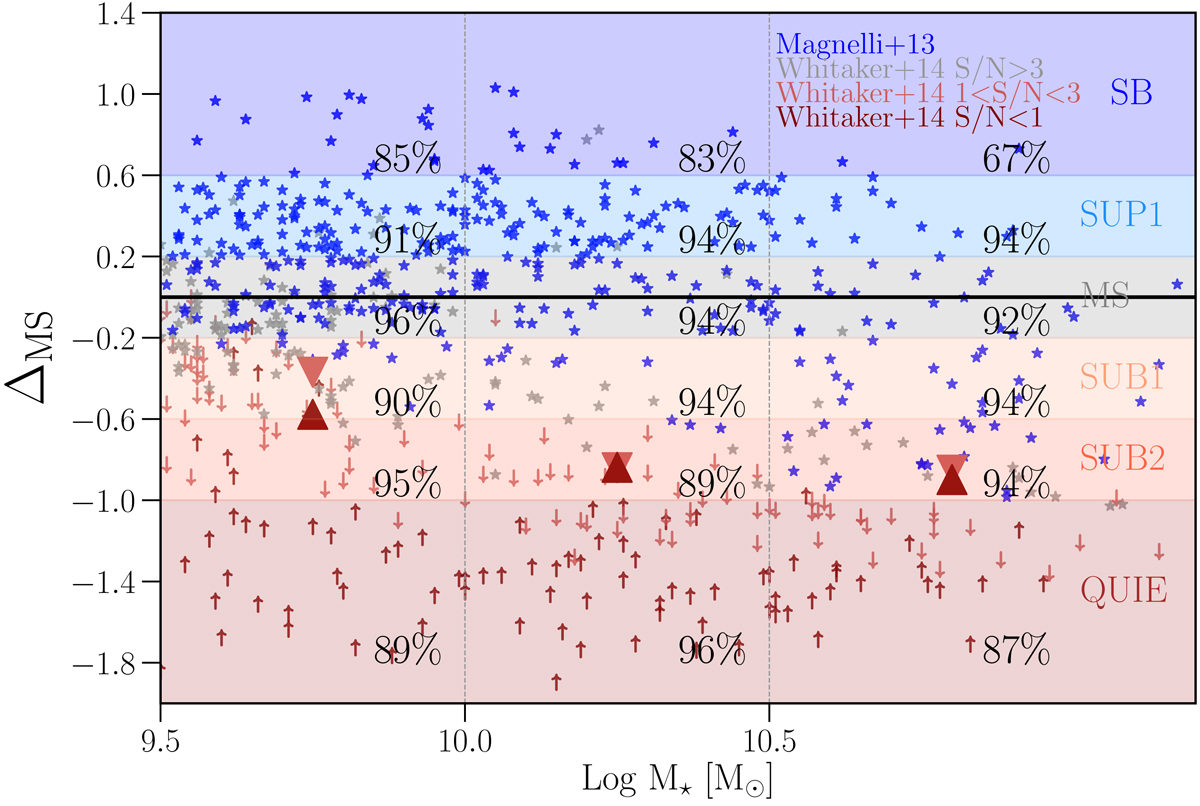
Distribution of galaxies in the ΔMS – Log M⋆ plane. Blue stars mark galaxies in the final sample with a counterpart in the Herschel catalogue of M13. Grey stars indicate galaxies with no counterpart in M13, but detected with MIPS. Galaxies that are not detected in MIPS are shown with arrows: pink when the 24 μm is given as an upper limit, and maroon when the SFR comes from UV only. The triangles show the average distance from the MS of galaxies undetected in MIPS, for which the SFR from SED fitting was used to compute ΔMS. The percentages represent the completeness of the final sample (after removal of AGNs and corrupted data from visual inspection) with respect to the total HDUV sample in the same redshift bin. The shaded regions mark the bins defined according to the distance from the MS, and will be used from now on in this work.
Current usage metrics show cumulative count of Article Views (full-text article views including HTML views, PDF and ePub downloads, according to the available data) and Abstracts Views on Vision4Press platform.
Data correspond to usage on the plateform after 2015. The current usage metrics is available 48-96 hours after online publication and is updated daily on week days.
Initial download of the metrics may take a while.