Fig. 9
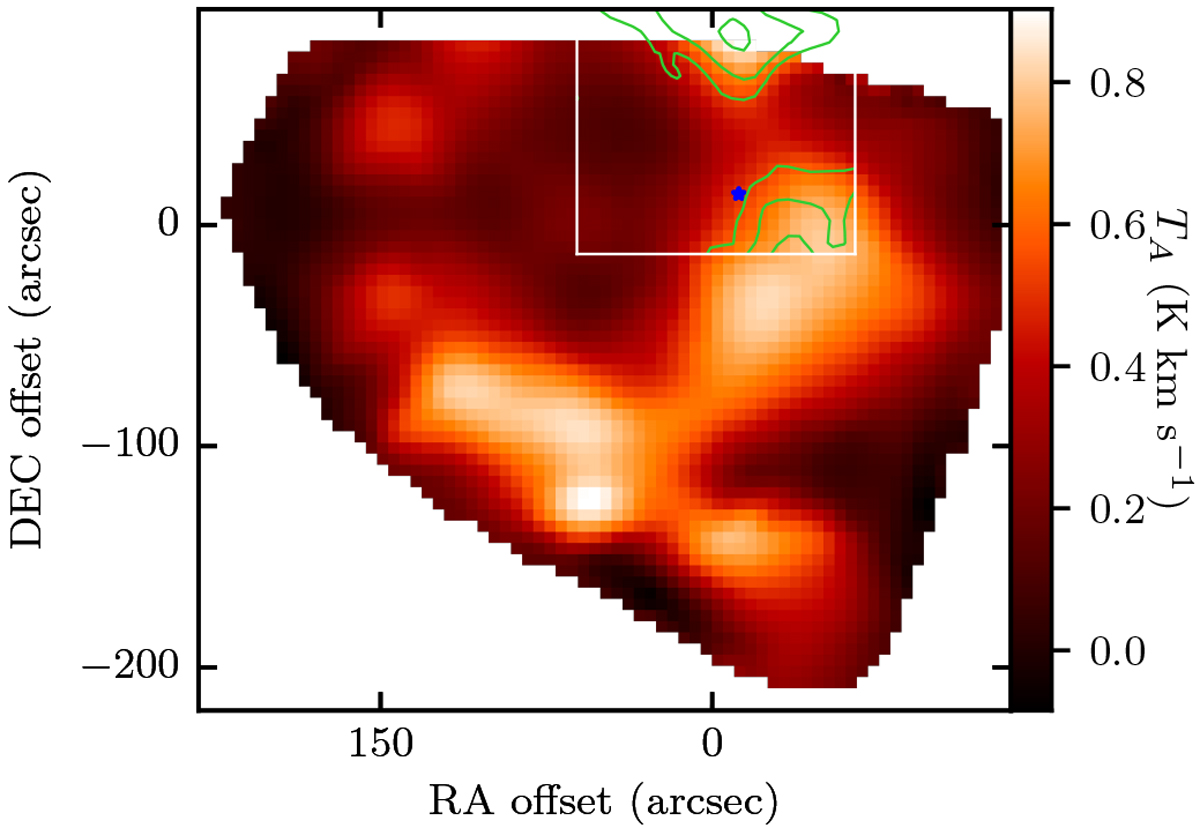
Moment 0 maps of C30α emission andC65α emission. The green contours show the C30α emission at values of 40, 60, and 80 mK km s−1. The color map shows the C65α emission (Wyrowski et al. 1997). The spatial resolution of the C30α map is 28′′, while that of the C65α map is 40′′. A white box shows the extent of the region mapped by ALMA where C30α is detected (southeast map in Bally et al. 2017). The spatial axes are given in offset with respect to M 42, and a blue star indicates the position of Θ1 Ori C.
Current usage metrics show cumulative count of Article Views (full-text article views including HTML views, PDF and ePub downloads, according to the available data) and Abstracts Views on Vision4Press platform.
Data correspond to usage on the plateform after 2015. The current usage metrics is available 48-96 hours after online publication and is updated daily on week days.
Initial download of the metrics may take a while.