Fig. 8
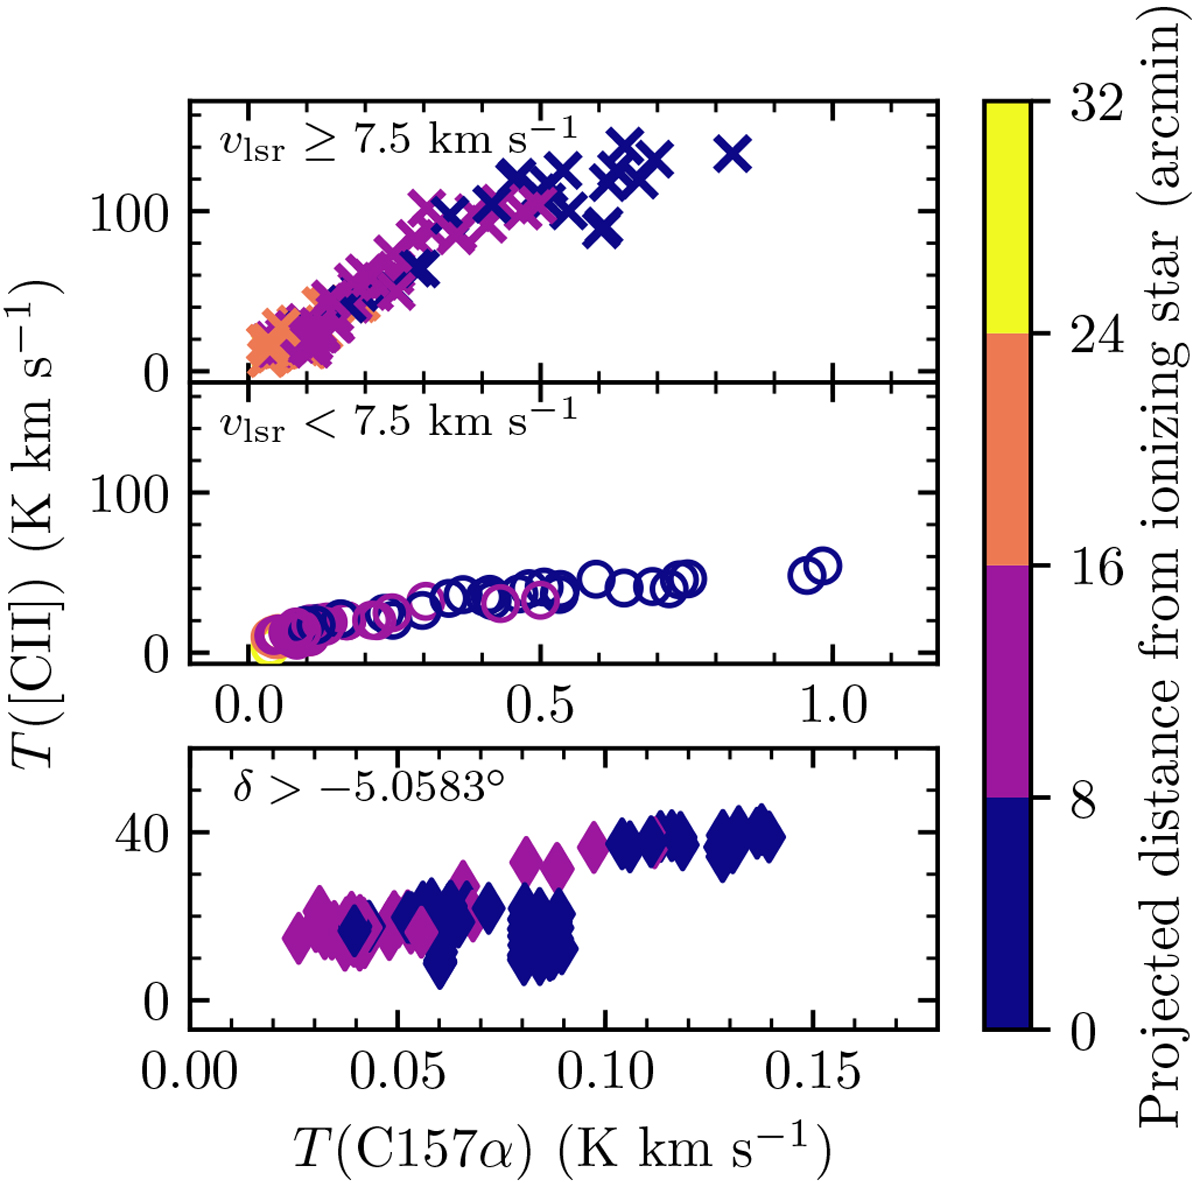
158μm-[CII] line intensityas a function of the C157α line intensity. The line emission is separated into different groups based on known features in the maps. Top panel: line emission with velocity in the range [4, 7.5) km s−1 and declination below − 5.0583°, associated with the Veil. Middle panel: line emission with velocity in the range [7.5, 12) km s−1 and declination below − 5.0583°, associated with the ISF. Bottom panel: line emission at declination above − 5.0583°, associated with S279.
Current usage metrics show cumulative count of Article Views (full-text article views including HTML views, PDF and ePub downloads, according to the available data) and Abstracts Views on Vision4Press platform.
Data correspond to usage on the plateform after 2015. The current usage metrics is available 48-96 hours after online publication and is updated daily on week days.
Initial download of the metrics may take a while.