Fig. 7
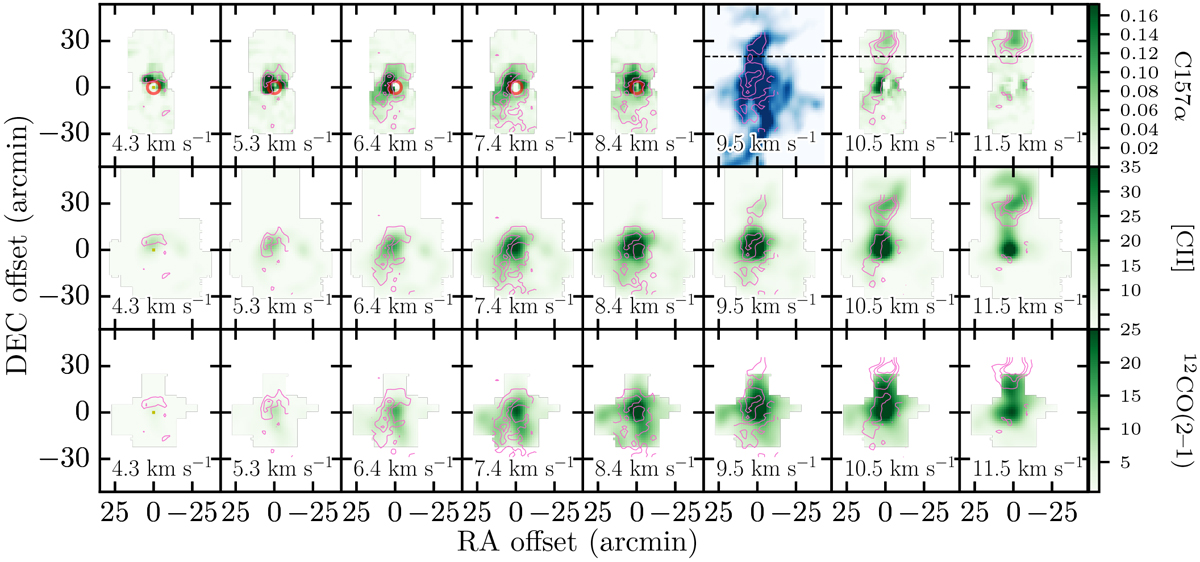
Channel maps of C157α (top row), 158μm-[CII] (middle row), and 12CO(2–1) (bottom row) line emission. The pink contours show C157α emission above 3σ in steps of 3σ, with σ being the standard deviation of the spectra (σ ≈ 10 mK). The velocity is indicated at the bottom of each panel. All cubes have been convolved to a spatial resolution of 8′.1. The velocity axes were averaged to match the velocity resolution of the C157α cube. The spatial axes are given in offset with respect to M 42. The red circle shows the extent of M 42 in the 21 cm continuum map of van der Werf et al. (2013). In the top panel with a velocity of 9.5 km s−1 the background image in blue is the 857 GHz emission as observed with Planck at 4.′6 resolution (Planck Collaboration I 2016). In the top row panels with a velocity ≥ 9.5 km s−1, the dashed line shows a declination of − 5.0583° (J2000), used to separate S279 from Orion A. The color scales at the right are in units of K.
Current usage metrics show cumulative count of Article Views (full-text article views including HTML views, PDF and ePub downloads, according to the available data) and Abstracts Views on Vision4Press platform.
Data correspond to usage on the plateform after 2015. The current usage metrics is available 48-96 hours after online publication and is updated daily on week days.
Initial download of the metrics may take a while.