Fig. 6
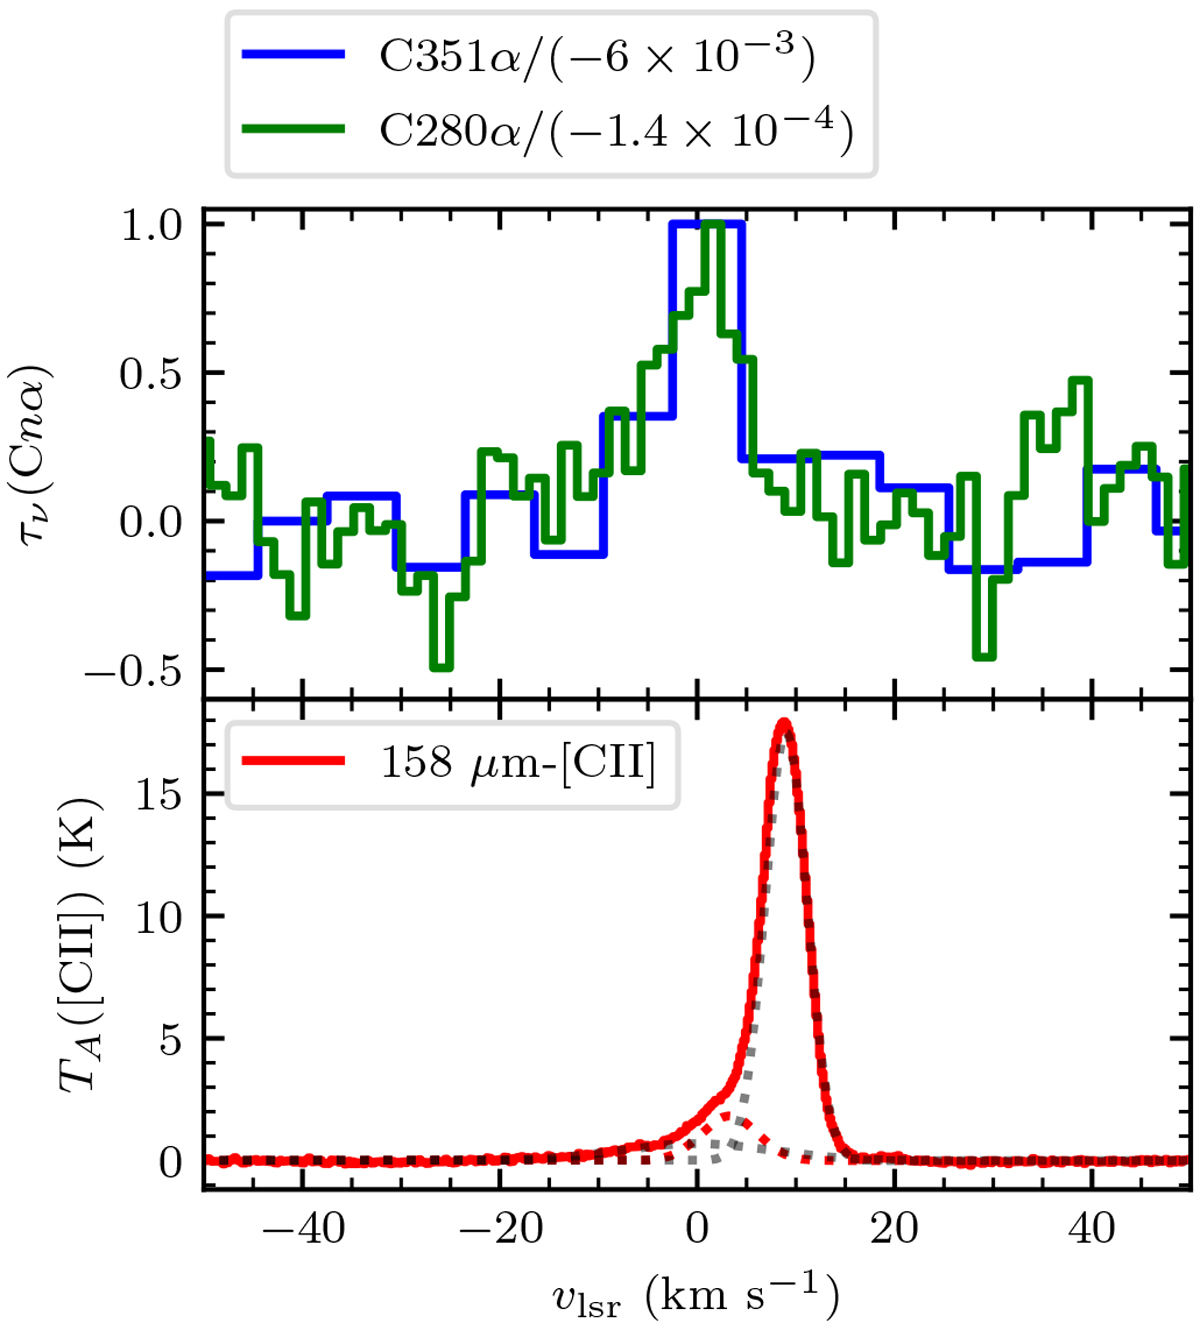
Comparison between the CRRLs observed in absorption and the 158μm-[CII] line. The blue steps show the C351α line profile inverted (from the LOFAR observations in 2014), the green steps the C280α line inverted (from the GBT observations AGBT02A_028), and the red steps show the 158μm-[CII] line (from the SOFIA observations of Pabst et al. 2019). The CRRLs trace a fainter velocity component in the 158μm-[CII] line due to the effect of stimulated emission. The dotted lines in the lower panel show the best fit Gaussian line profiles used to decompose the 158μm-[CII] line (the properties of these components are given in Table 3). The spectra are the spatial average over a circle 36′ in diameter centered on M 42.
Current usage metrics show cumulative count of Article Views (full-text article views including HTML views, PDF and ePub downloads, according to the available data) and Abstracts Views on Vision4Press platform.
Data correspond to usage on the plateform after 2015. The current usage metrics is available 48-96 hours after online publication and is updated daily on week days.
Initial download of the metrics may take a while.