Fig. 3
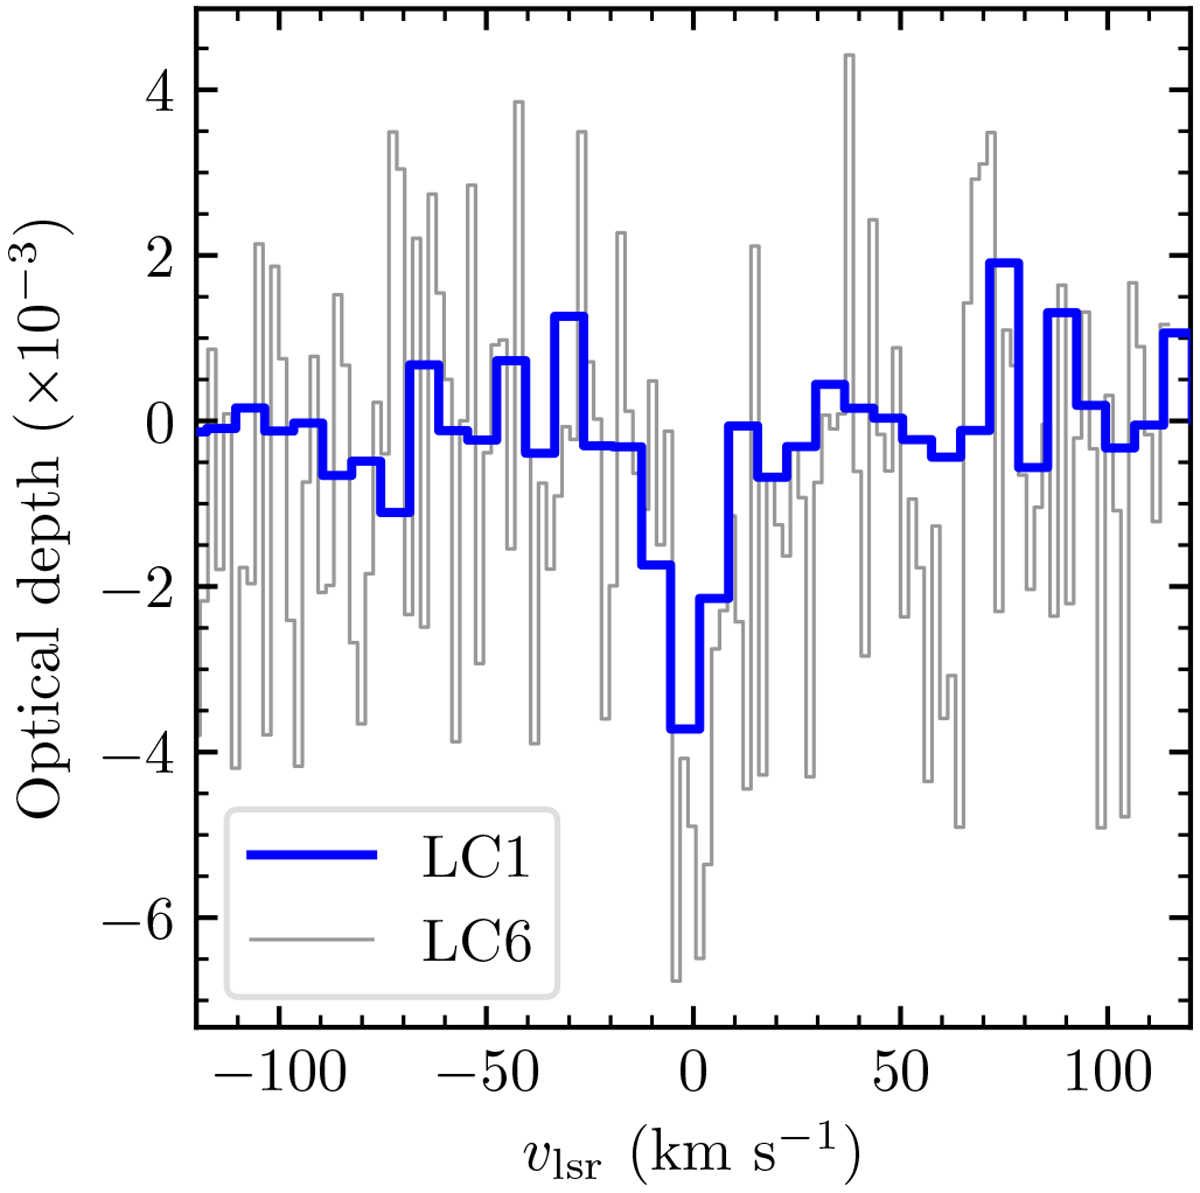
LOFAR spectra of C351α observed on two different nights. The blue steps show the spectra obtained from observations performed during February 2014 and the gray steps for observations taken during October 2016. The 2014 detection, with a S/N of 4.5, is confirmed by the 2016 observations(with a S/N of 2.5). The spectra are the spatial average over a 9′× 9′ box centered on M 42.
Current usage metrics show cumulative count of Article Views (full-text article views including HTML views, PDF and ePub downloads, according to the available data) and Abstracts Views on Vision4Press platform.
Data correspond to usage on the plateform after 2015. The current usage metrics is available 48-96 hours after online publication and is updated daily on week days.
Initial download of the metrics may take a while.