Fig. 2
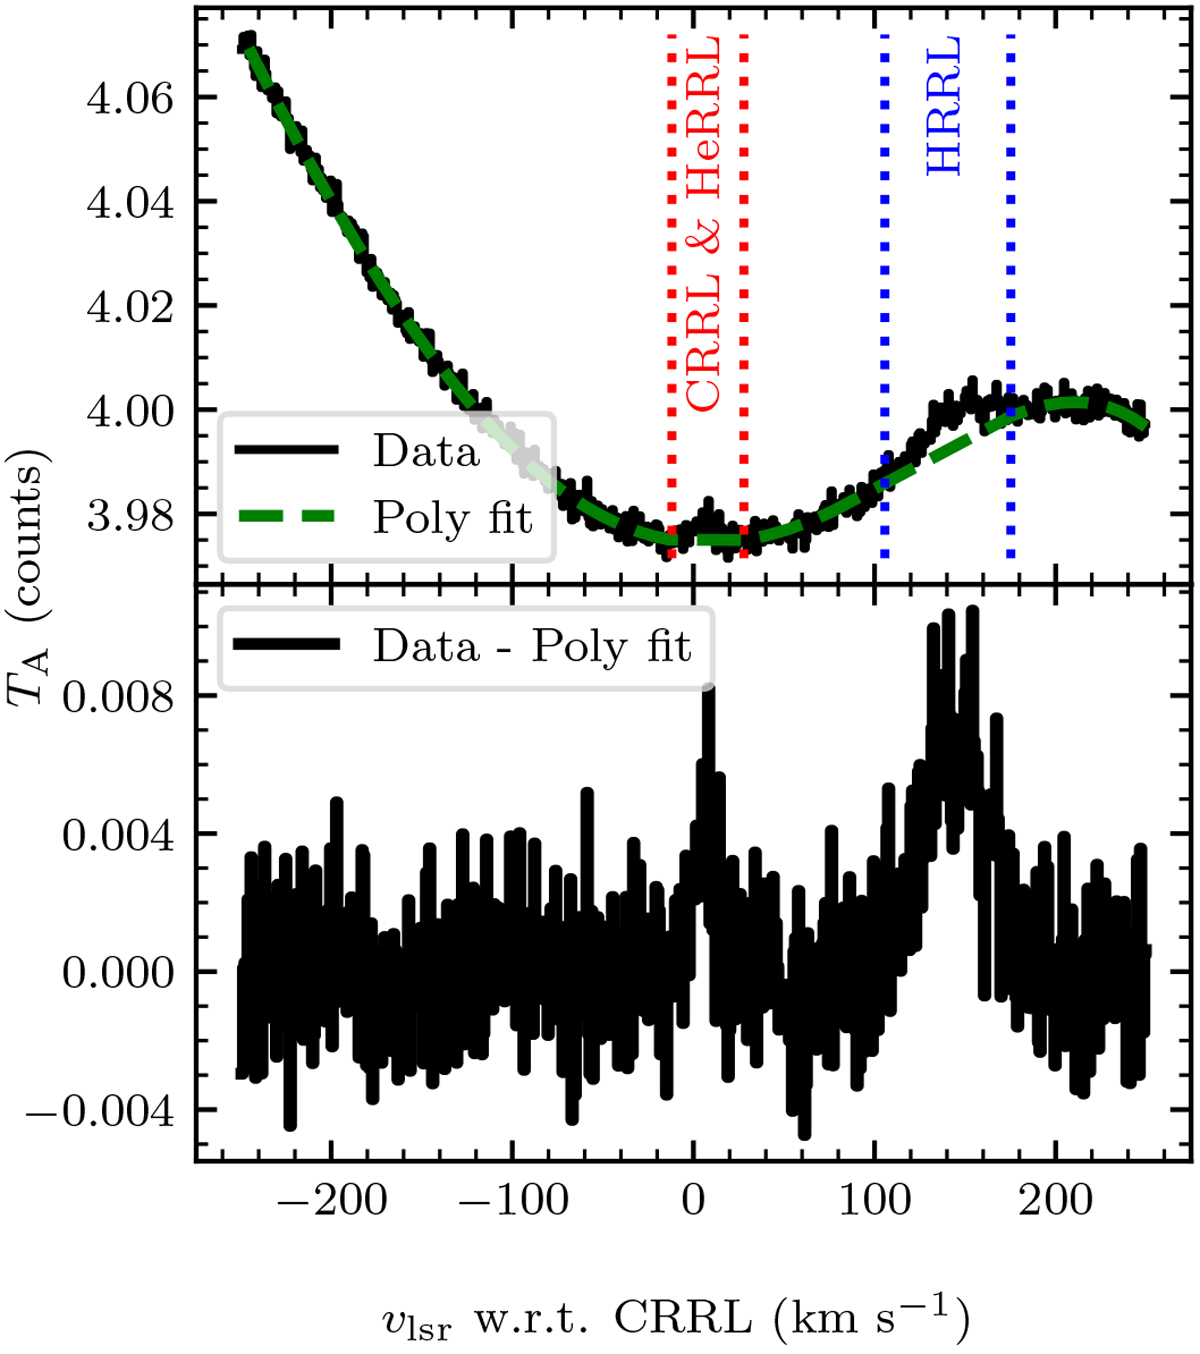
Example of the baseline removal process for the GBT observations. Upper panel: raw data (in black) and the polynomial (green dashed line) used to remove the shape of the bandpass from the data. In this example a polynomial of order five was used. The red and blue dotted lines show the ranges where we expect the RRLs. These ranges are not considered while fitting the polynomial. Bottom panel: data after subtraction of the polynomial used to capture the bandpass shape. The velocity axis is referenced with respect to the rest frequency of the corresponding CRRL. This data is part of project AGBT12A_484.
Current usage metrics show cumulative count of Article Views (full-text article views including HTML views, PDF and ePub downloads, according to the available data) and Abstracts Views on Vision4Press platform.
Data correspond to usage on the plateform after 2015. The current usage metrics is available 48-96 hours after online publication and is updated daily on week days.
Initial download of the metrics may take a while.