Fig. 14
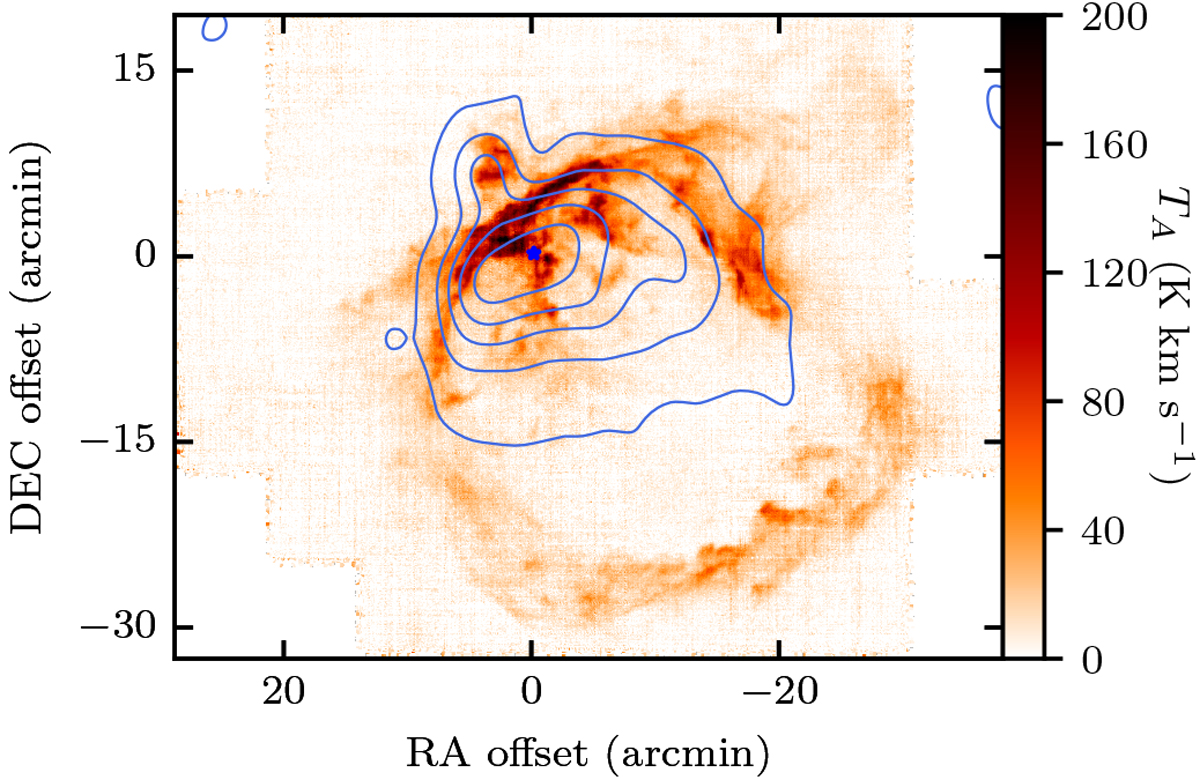
Moment 0 map of the 158μm-[CII] line associated with the Veil (color scale). The moment 0 map considers emission for velocities between 0 and 7 km s−1. The contours show the radio continuum as observed with LOFAR at 149 MHz. The contours start at 0.2 mJy beam−1 and increase in steps of 1 Jy beam−1. The spatial axes are given in offset with respect to M 42, and a blue star indicates the position of Θ1 Ori C. The radio continuum partially fills the wind blown bubble.
Current usage metrics show cumulative count of Article Views (full-text article views including HTML views, PDF and ePub downloads, according to the available data) and Abstracts Views on Vision4Press platform.
Data correspond to usage on the plateform after 2015. The current usage metrics is available 48-96 hours after online publication and is updated daily on week days.
Initial download of the metrics may take a while.