Fig. 13
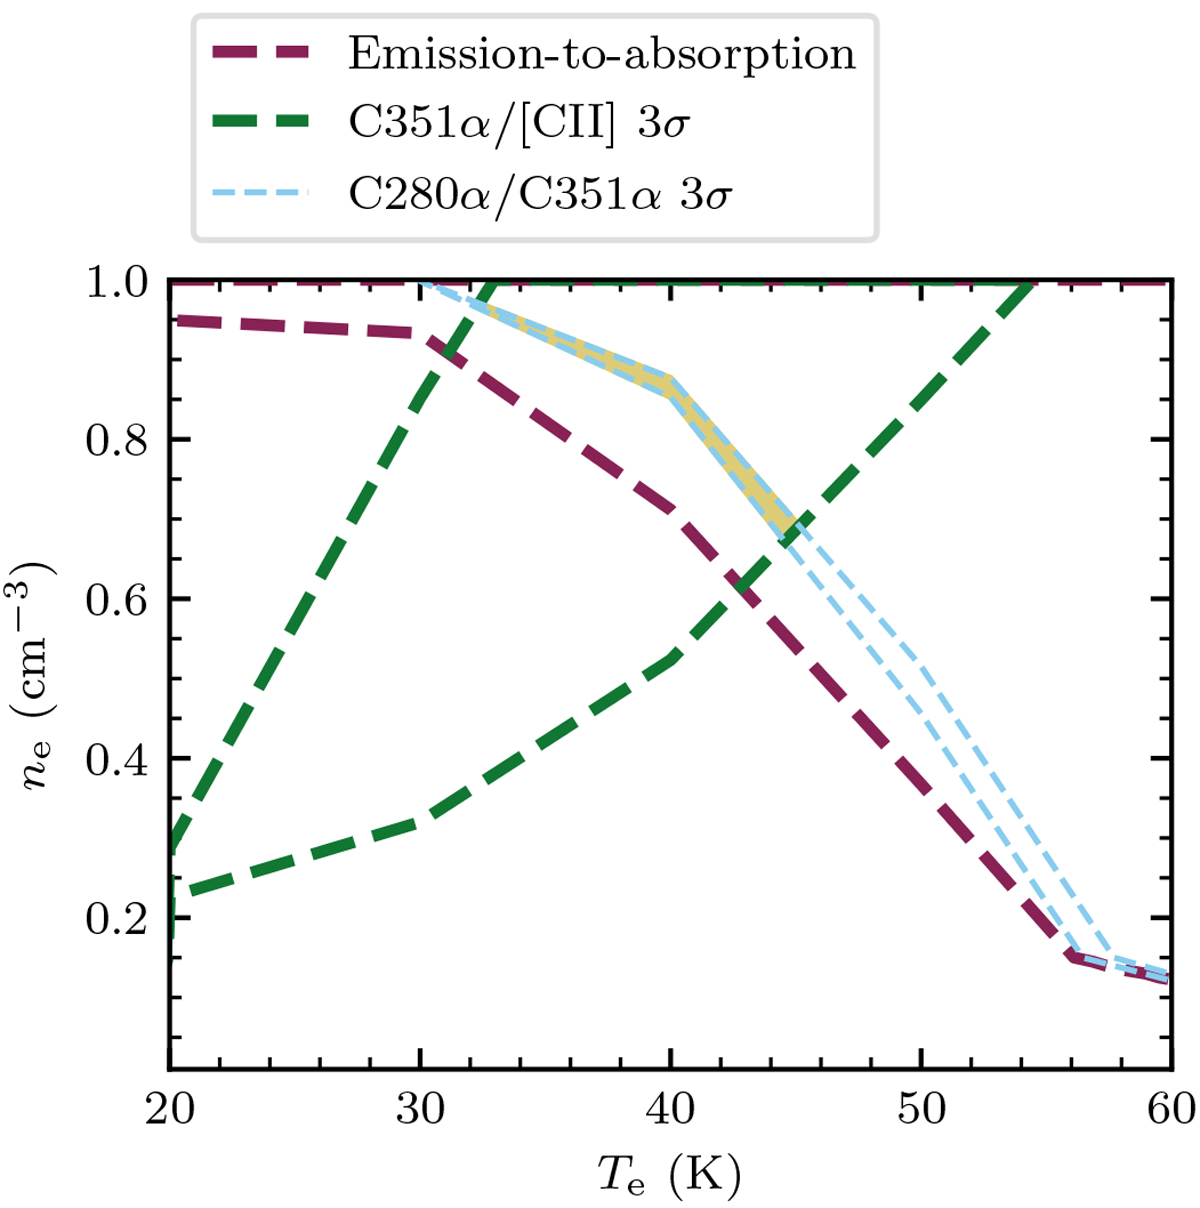
Constraints on the temperature and electron density for gas associated with Orion’s Veil. The dashed lines show the constraints on the gas properties derived from different observables: the transition of the CRRLs from emission to absorption between n = 200 and 279 (purple); theratio of the integrated optical depths of the C280α and C351α lines (light blue); the ratio of the C351α velocity integrated optical depth to the 158μm-[CII] line intensity(green). All the constraints shown are 3σ ranges. The region where the constraints overlap is shown as a yellow shaded region, close to 0.9 cm−3 and 40 K.
Current usage metrics show cumulative count of Article Views (full-text article views including HTML views, PDF and ePub downloads, according to the available data) and Abstracts Views on Vision4Press platform.
Data correspond to usage on the plateform after 2015. The current usage metrics is available 48-96 hours after online publication and is updated daily on week days.
Initial download of the metrics may take a while.