Fig. 11
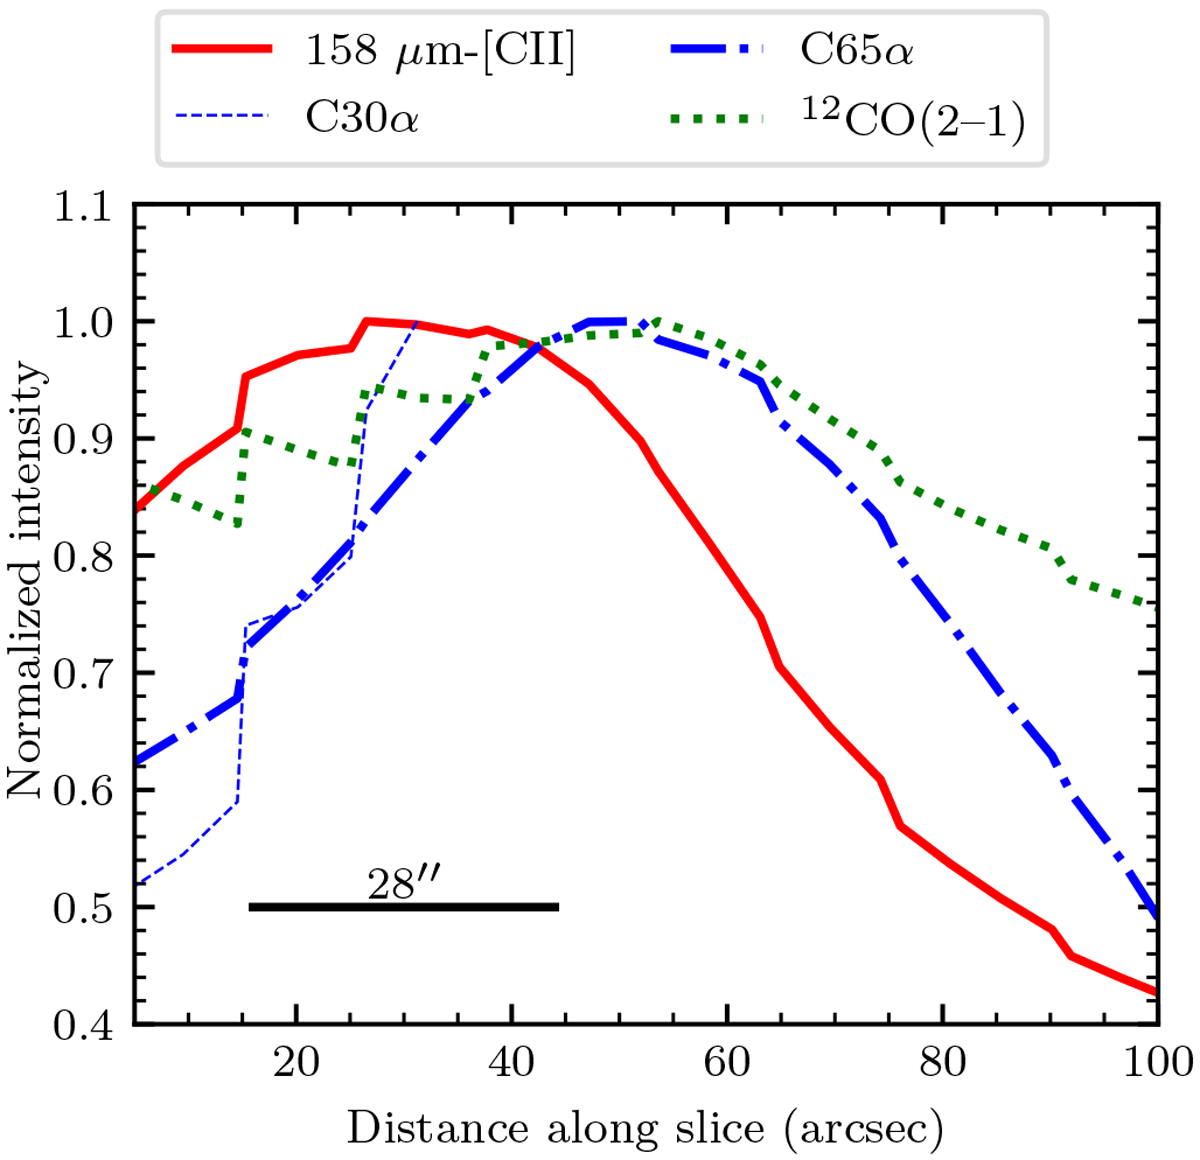
Comparison of the intensities of the C30α, 158μm-[CII] (Pabst et al. 2019), and 12CO(2–1) (Berné et al. 2014) lines. The thin dashed blue line shows the C30α line profile, the blue dash-dotted line for the C65α line, the red solid line for the 158μm-[CII] line, and the green dotted line for the 12CO(2–1) line. The slice from where the velocity integrated brightness profiles was extracted is shown in Fig. 10. The position of Θ1 Ori C marks the origin of the distance scale.
Current usage metrics show cumulative count of Article Views (full-text article views including HTML views, PDF and ePub downloads, according to the available data) and Abstracts Views on Vision4Press platform.
Data correspond to usage on the plateform after 2015. The current usage metrics is available 48-96 hours after online publication and is updated daily on week days.
Initial download of the metrics may take a while.