Fig. 10
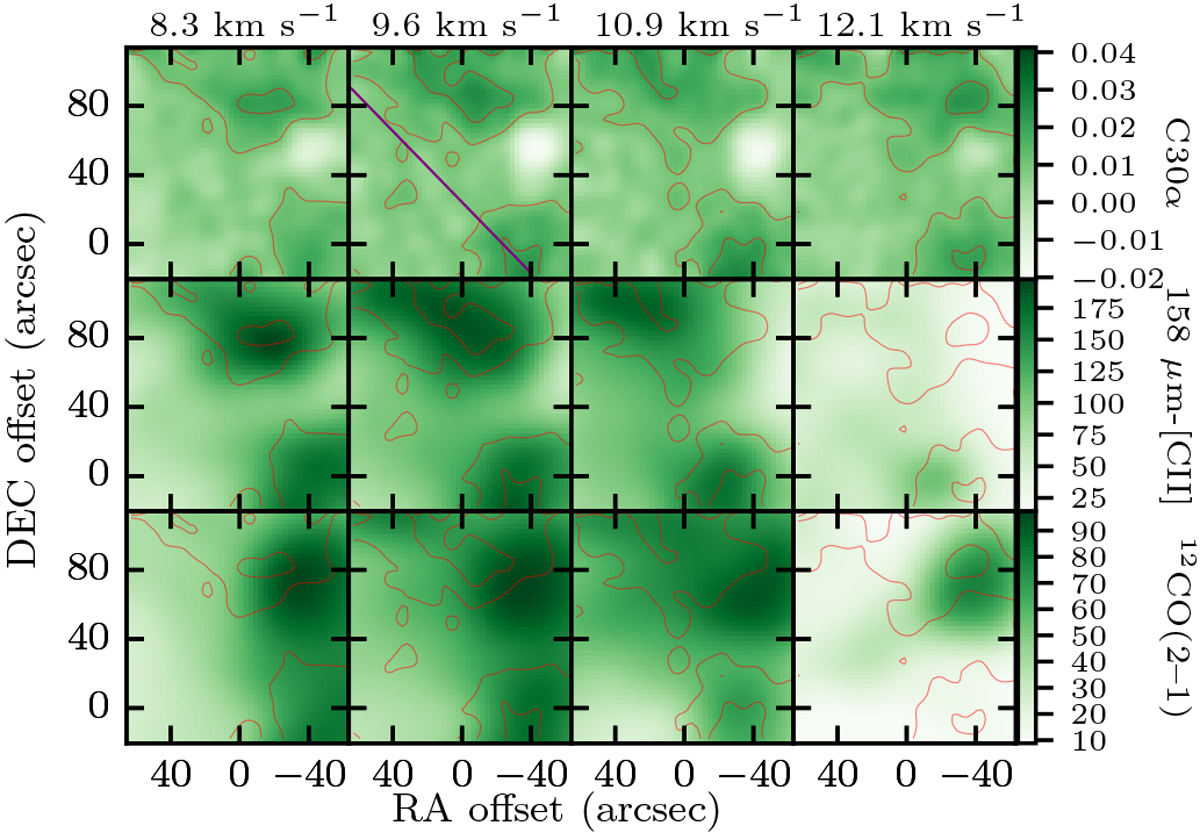
Channel maps of C30α (top row), 158μm-[CII] (middle row), and 12CO(2–1) (bottom row) line emission. The red contours show C30α emission above 10 mK, in steps of 10 mK. The velocity with respect to the local standard of rest is indicated at the top of each row. All cubes have been convolved to a spatial resolution of 28′′. The velocity axes were averaged and then linearly interpolated to match the velocity axis of the C30α cube. The spatial axes are given in offset with respect to M 42. In the C30α panel with a velocity of 9.6 km s−1 a solid purple line shows the slice used to extract the brightness profile presented in Fig. 11.
Current usage metrics show cumulative count of Article Views (full-text article views including HTML views, PDF and ePub downloads, according to the available data) and Abstracts Views on Vision4Press platform.
Data correspond to usage on the plateform after 2015. The current usage metrics is available 48-96 hours after online publication and is updated daily on week days.
Initial download of the metrics may take a while.