Fig. 6.
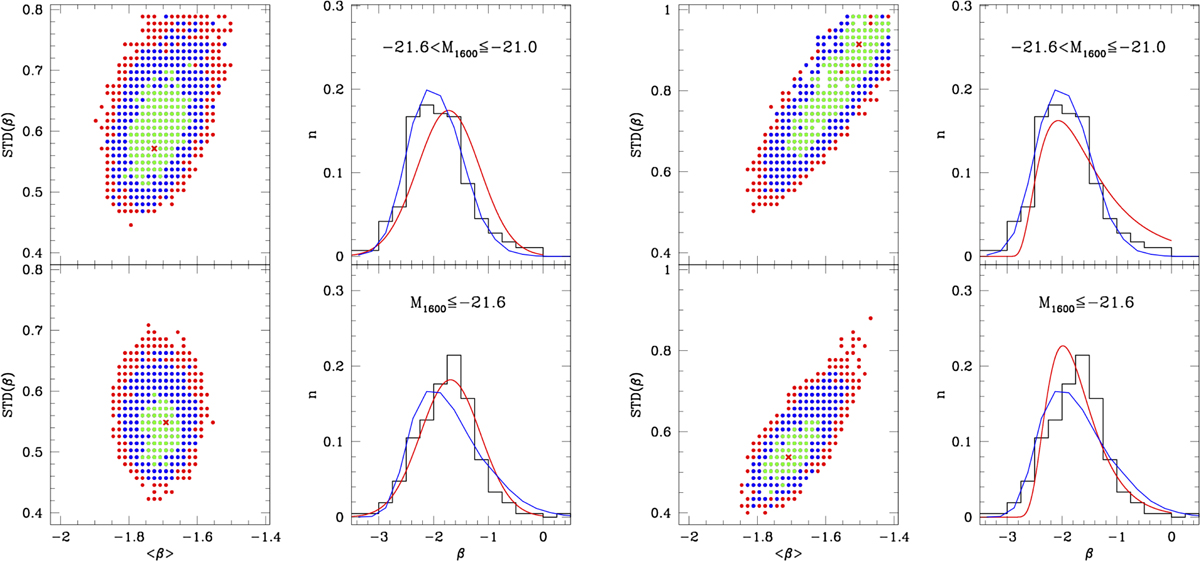
Simulation results for the Gaussian (left panel) and log-normal (right panel) fit in the two different magnitude bins. In the leftmost column, we show maximum likelihood contours at 68%, 95%, and 99% c.l. in green, blue, and red, respectively; the red cross indicates the position of the best fit parameters. The rightmost column shows the histogram of the observed data and the relevant best-fit distribution. The red continuous line is the intrinsic PDF(β), which is transformed into the blue continuous line by observational effects.
Current usage metrics show cumulative count of Article Views (full-text article views including HTML views, PDF and ePub downloads, according to the available data) and Abstracts Views on Vision4Press platform.
Data correspond to usage on the plateform after 2015. The current usage metrics is available 48-96 hours after online publication and is updated daily on week days.
Initial download of the metrics may take a while.