Fig. 4.
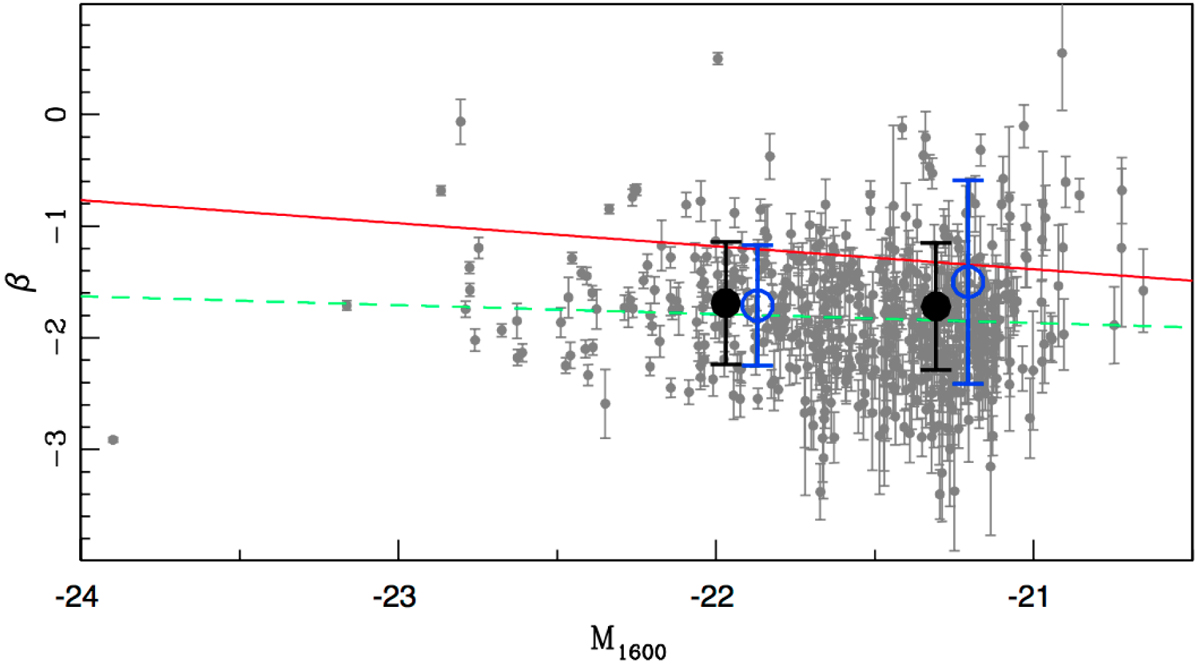
UV slope as a function of M1600. Black filled (blue open) circles show the best-fit values of the Gaussian (log-normal) distributions in each magnitude bin along with the relevant 1σ scatter. The mean β value is at ⟨β⟩ = − 1.82. The red line is the β–UV relation by Bouwens et al. (2009). The green dashed line marks the linear fit to our data.
Current usage metrics show cumulative count of Article Views (full-text article views including HTML views, PDF and ePub downloads, according to the available data) and Abstracts Views on Vision4Press platform.
Data correspond to usage on the plateform after 2015. The current usage metrics is available 48-96 hours after online publication and is updated daily on week days.
Initial download of the metrics may take a while.