Fig. 2.
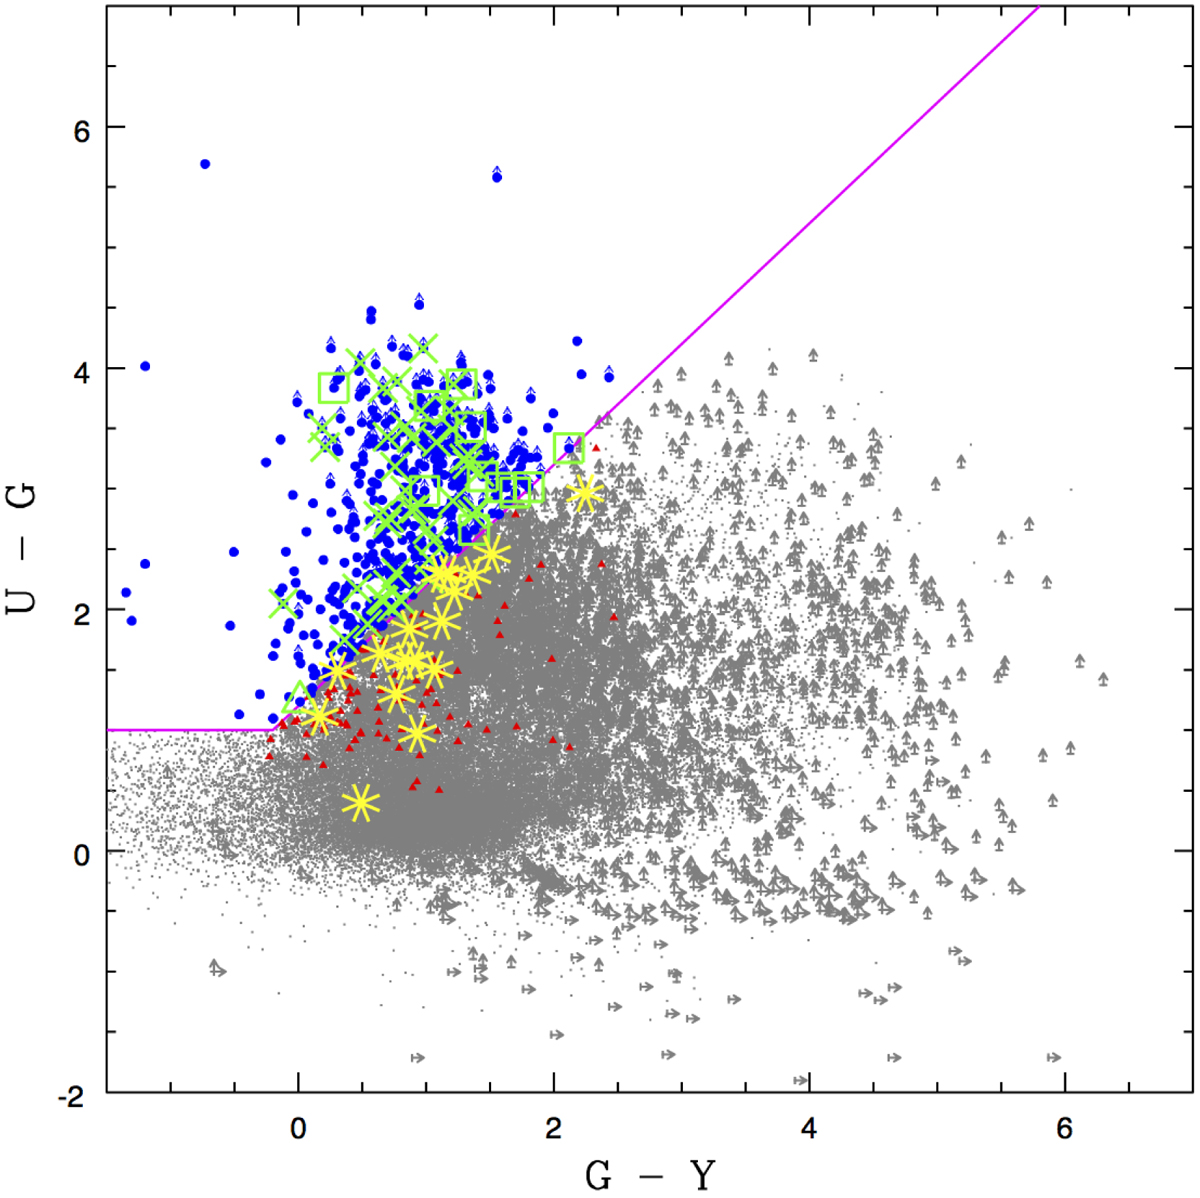
UGY selected objects (blue points) along with objects selected with the UGR criterion that are excluded by the UGY criterion (red triangles). Upwards-pointing and right-pointing arrows mark upper limits in the U and G band, respectively. Objects with spectroscopic redshift in the range 2.7 < z < 3.3 are marked as green crosses. Open triangles and open squares indicate sources at z < 2.7 and z > 3.3, respectively. Objects in the expected redshift range that are excluded by our selection are indicated in yellow.
Current usage metrics show cumulative count of Article Views (full-text article views including HTML views, PDF and ePub downloads, according to the available data) and Abstracts Views on Vision4Press platform.
Data correspond to usage on the plateform after 2015. The current usage metrics is available 48-96 hours after online publication and is updated daily on week days.
Initial download of the metrics may take a while.