Free Access
Fig. 7
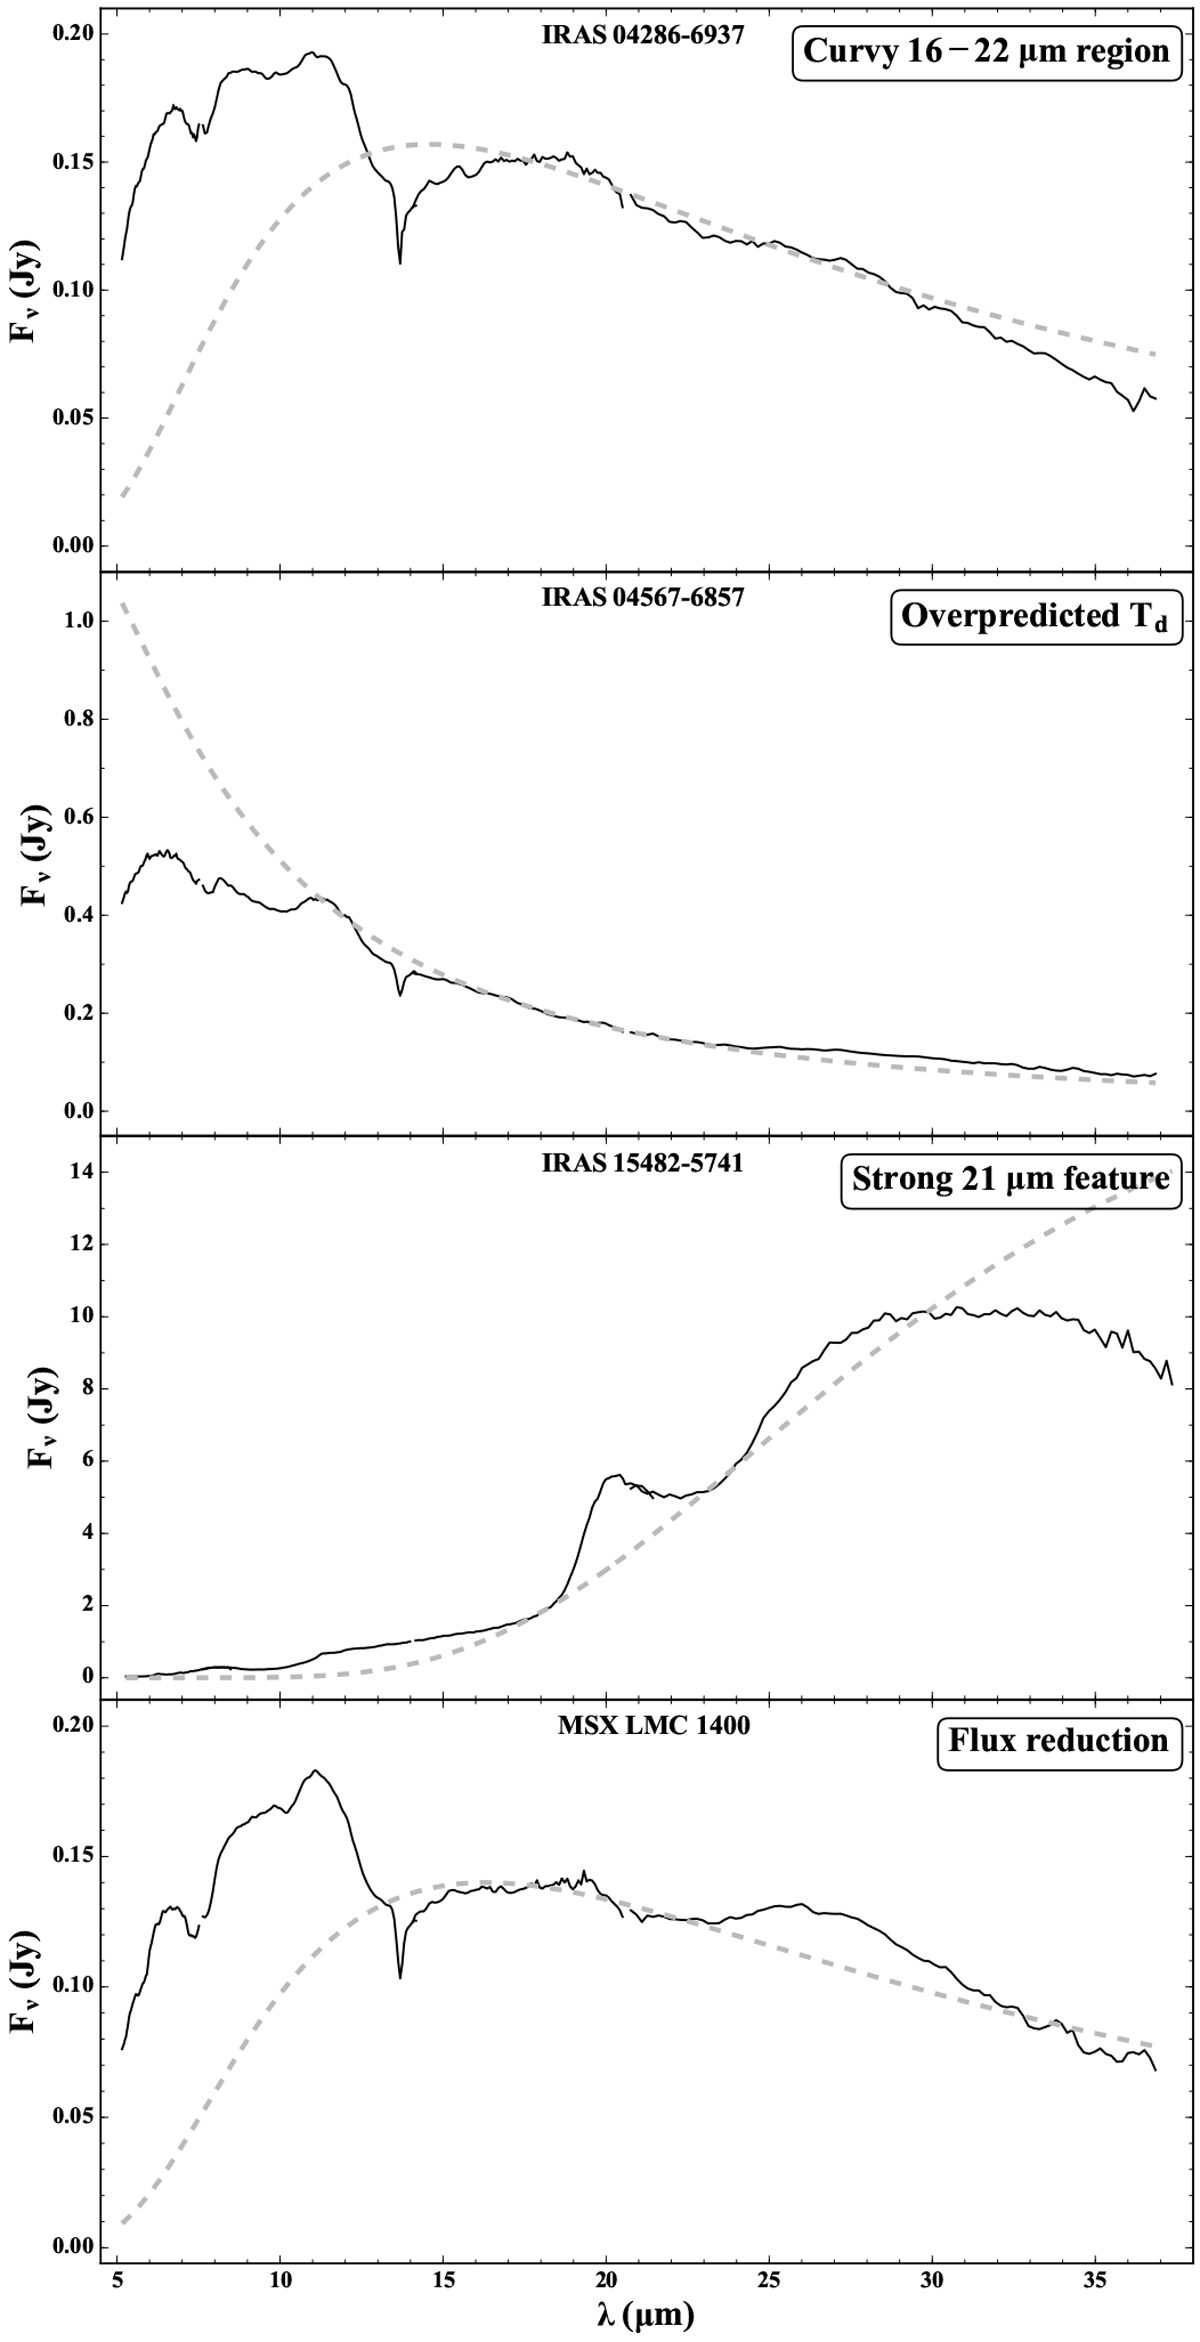
Examples of the bad continuum fits to the spectra showing the constraints of the Manchester method. The spectra are drawn in black solid lines, while the grey dashed lines show the fitted black-body with a single temperature. The names of the objects are shown in the upper-central part of each panel.
Current usage metrics show cumulative count of Article Views (full-text article views including HTML views, PDF and ePub downloads, according to the available data) and Abstracts Views on Vision4Press platform.
Data correspond to usage on the plateform after 2015. The current usage metrics is available 48-96 hours after online publication and is updated daily on week days.
Initial download of the metrics may take a while.