Fig. 2
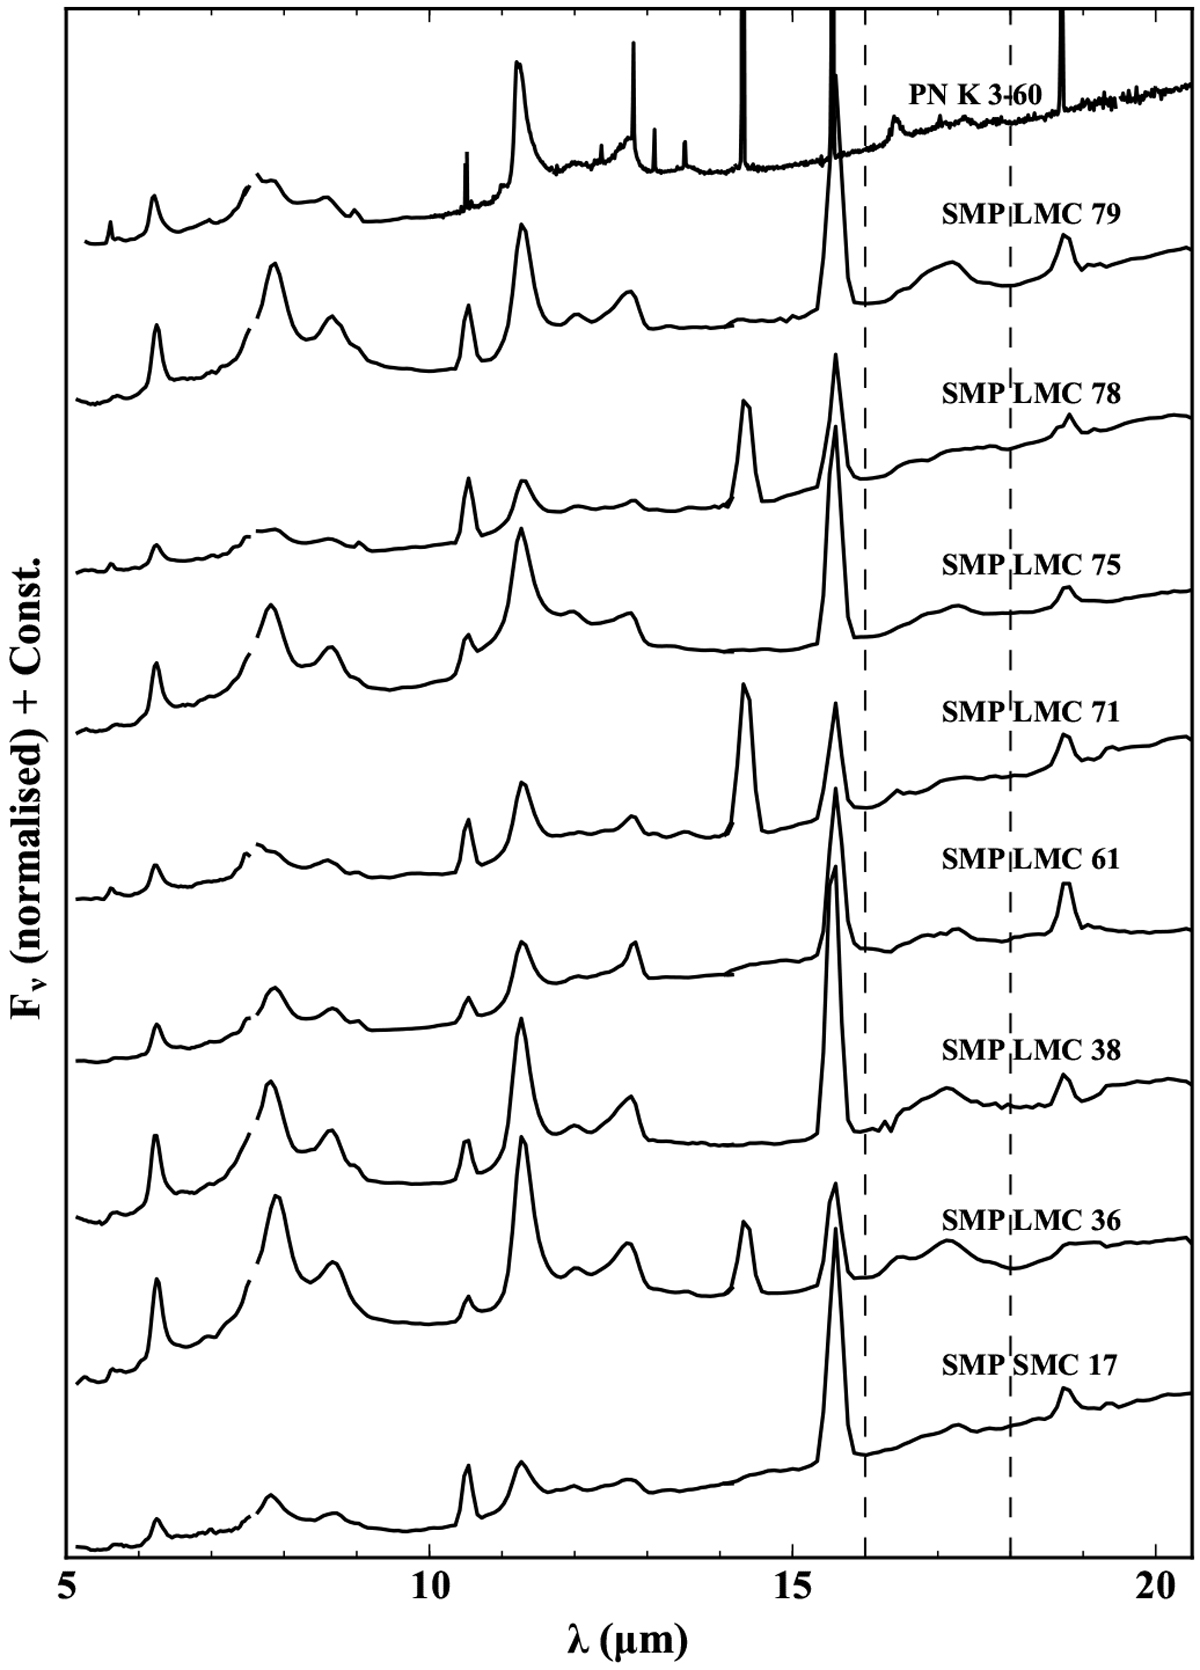
5–20.5μm spectra for objects showing the 16–18 μm emission feature (solid lines). These spectra are normalised to the flux density at 18 μm. The names of objects are shown above the spectra. The spectrum of PN K3-60 was partially obtained using low (SL) and high-resolution (SH/LH) modes. The region containing this feature is shown by the dashed vertical lines.
Current usage metrics show cumulative count of Article Views (full-text article views including HTML views, PDF and ePub downloads, according to the available data) and Abstracts Views on Vision4Press platform.
Data correspond to usage on the plateform after 2015. The current usage metrics is available 48-96 hours after online publication and is updated daily on week days.
Initial download of the metrics may take a while.