Fig. 9.
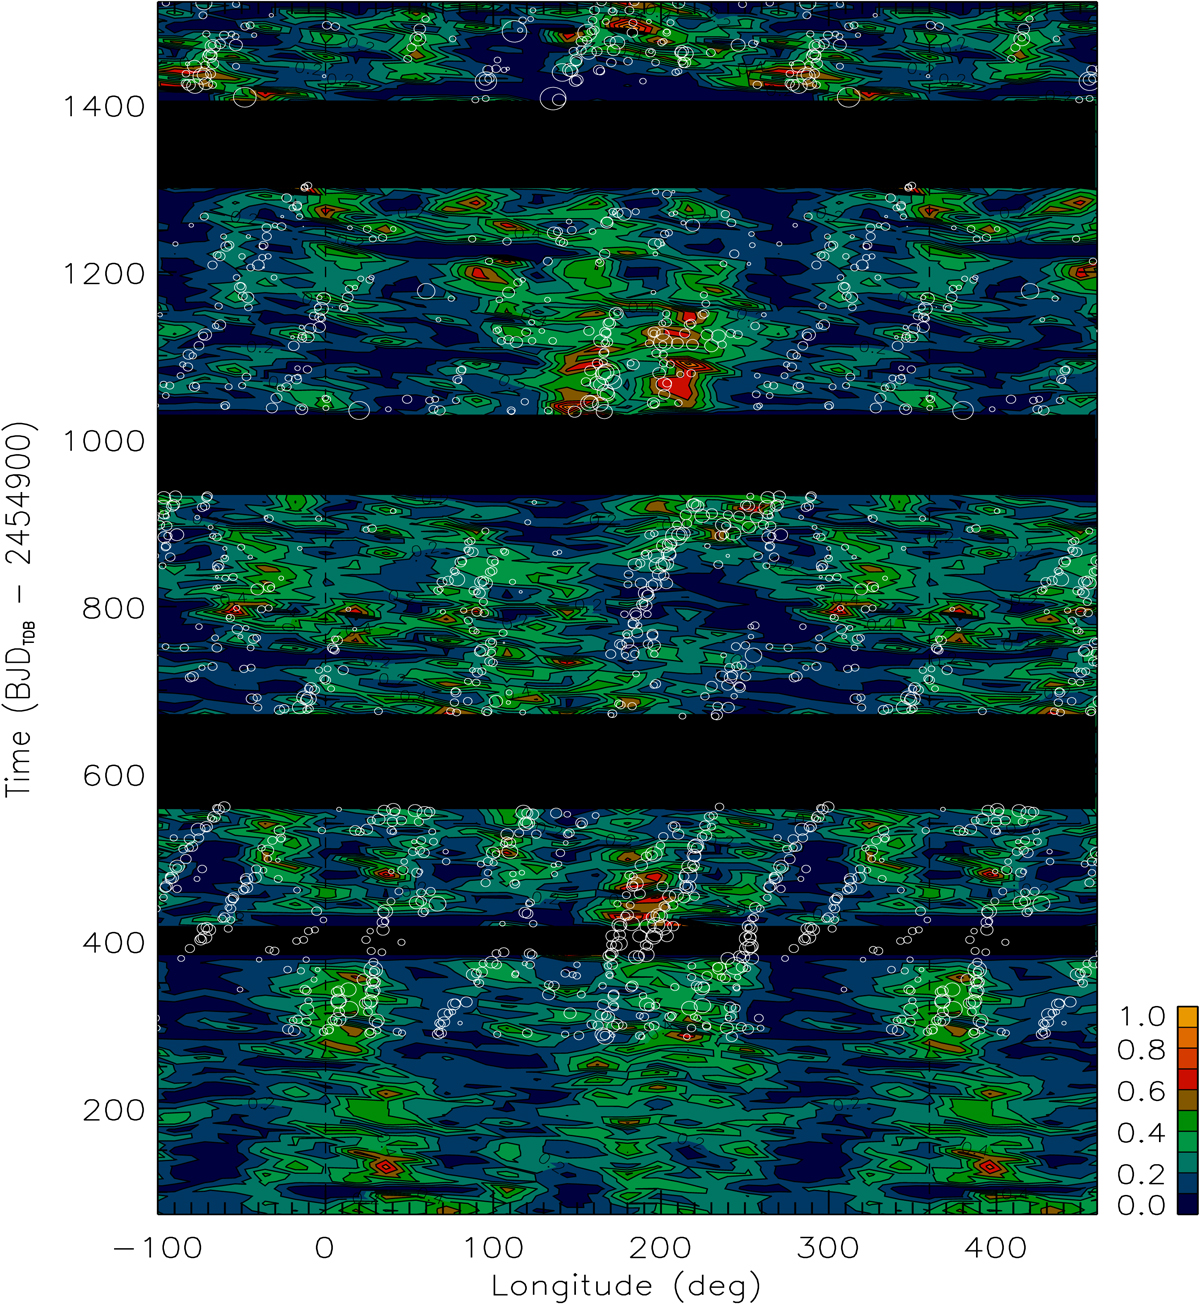
Distribution of the spot filling factor vs. the longitude and time as derived by our maximum-entropy spot model of the long-cadence ARC2 light curve. The maximum of the filling factor is indicated by the yellow-orange colour, while the minimum by dark blue (see colour scale in the lower right corner). We note that the longitude scale is repeated beyond the [0° ,360°] interval to better follow the migration of the spot features. White circles mark the longitude and time of the spots occulted by the planet during transits as detected by modelling transit profiles observed in short cadence (Valio et al. 2017). Their size is proportional to their flux deficit D as defined in Sect. 5.2 (see the text). Data gaps without enough observations to compute a spot map along the individual Δtf intervals are indicated by a black bands. We note that short-cadence transit data are available during the first gap of the light curve extracted by the ARC2 pipeline.
Current usage metrics show cumulative count of Article Views (full-text article views including HTML views, PDF and ePub downloads, according to the available data) and Abstracts Views on Vision4Press platform.
Data correspond to usage on the plateform after 2015. The current usage metrics is available 48-96 hours after online publication and is updated daily on week days.
Initial download of the metrics may take a while.