Fig. 4.
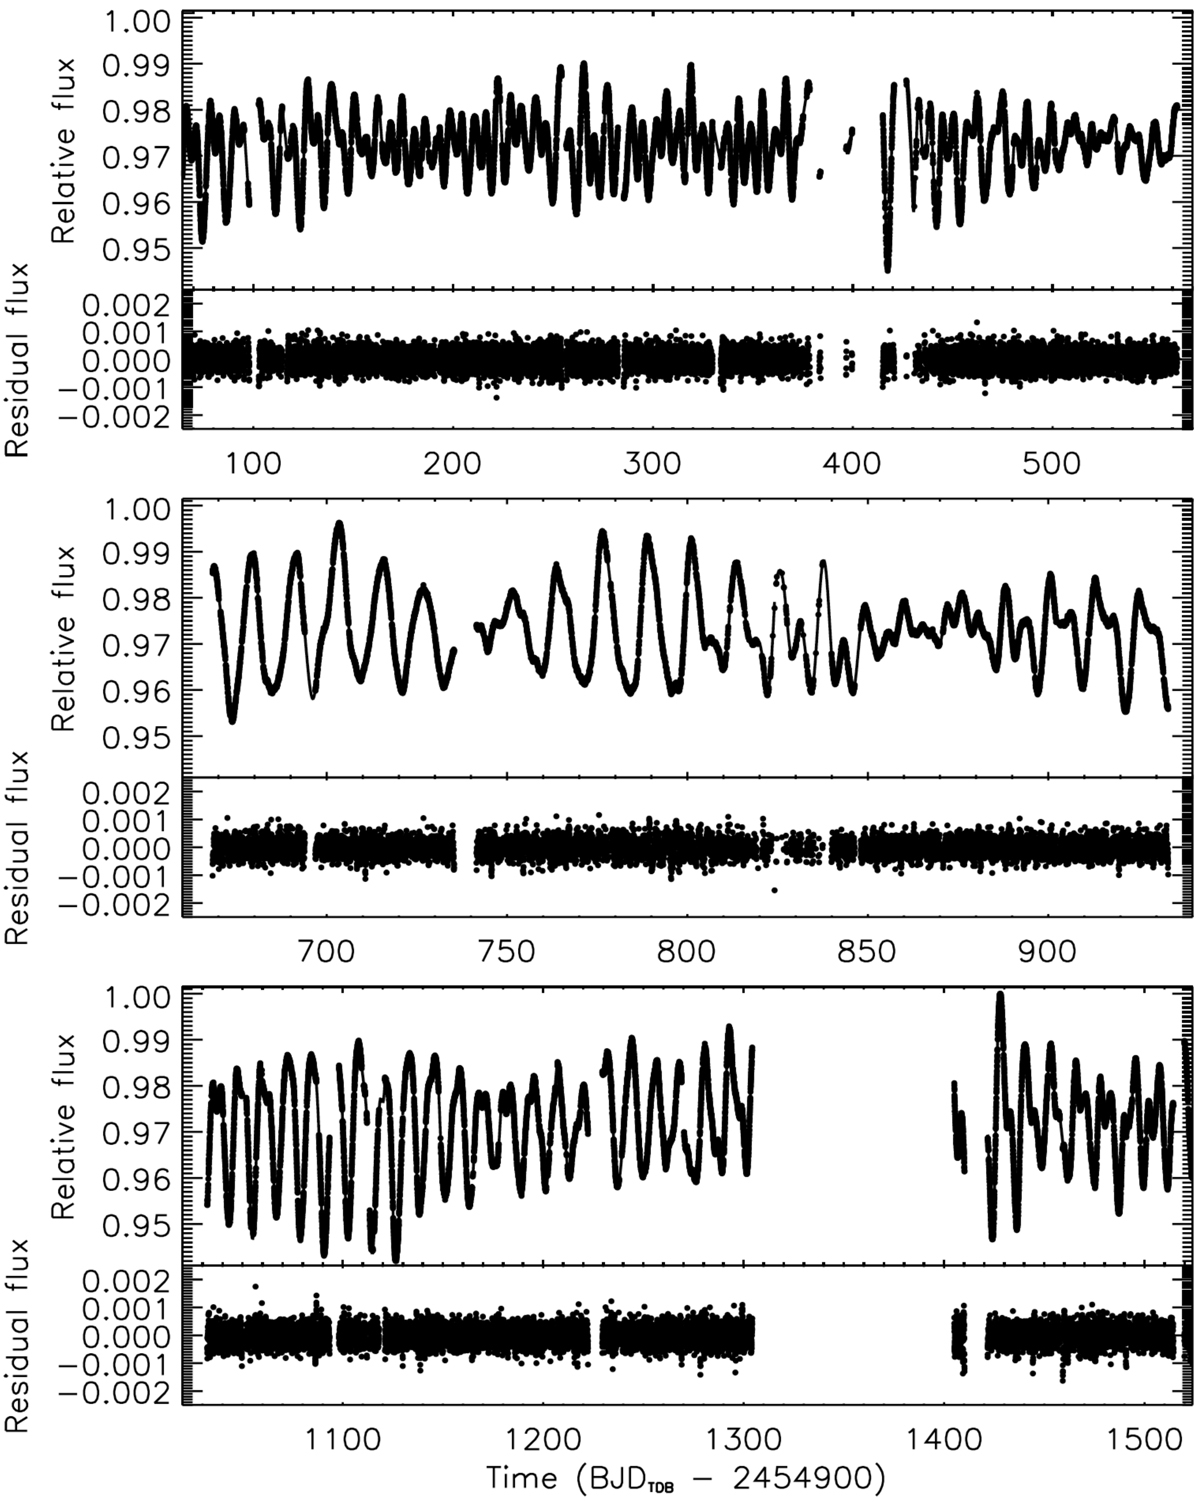
Top panel: light curve detrended with the ARC2 pipeline and fitted with our composite maximum-entropy regularized spot model and the parameters listed in Table 1. The observed flux, normalized to its maximum value, is plotted vs. time (filled dots) and the best fit is superposed (solid line). Lower panels: residual of the regularized best fit vs. time (filled dots).
Current usage metrics show cumulative count of Article Views (full-text article views including HTML views, PDF and ePub downloads, according to the available data) and Abstracts Views on Vision4Press platform.
Data correspond to usage on the plateform after 2015. The current usage metrics is available 48-96 hours after online publication and is updated daily on week days.
Initial download of the metrics may take a while.