Fig. B.1.
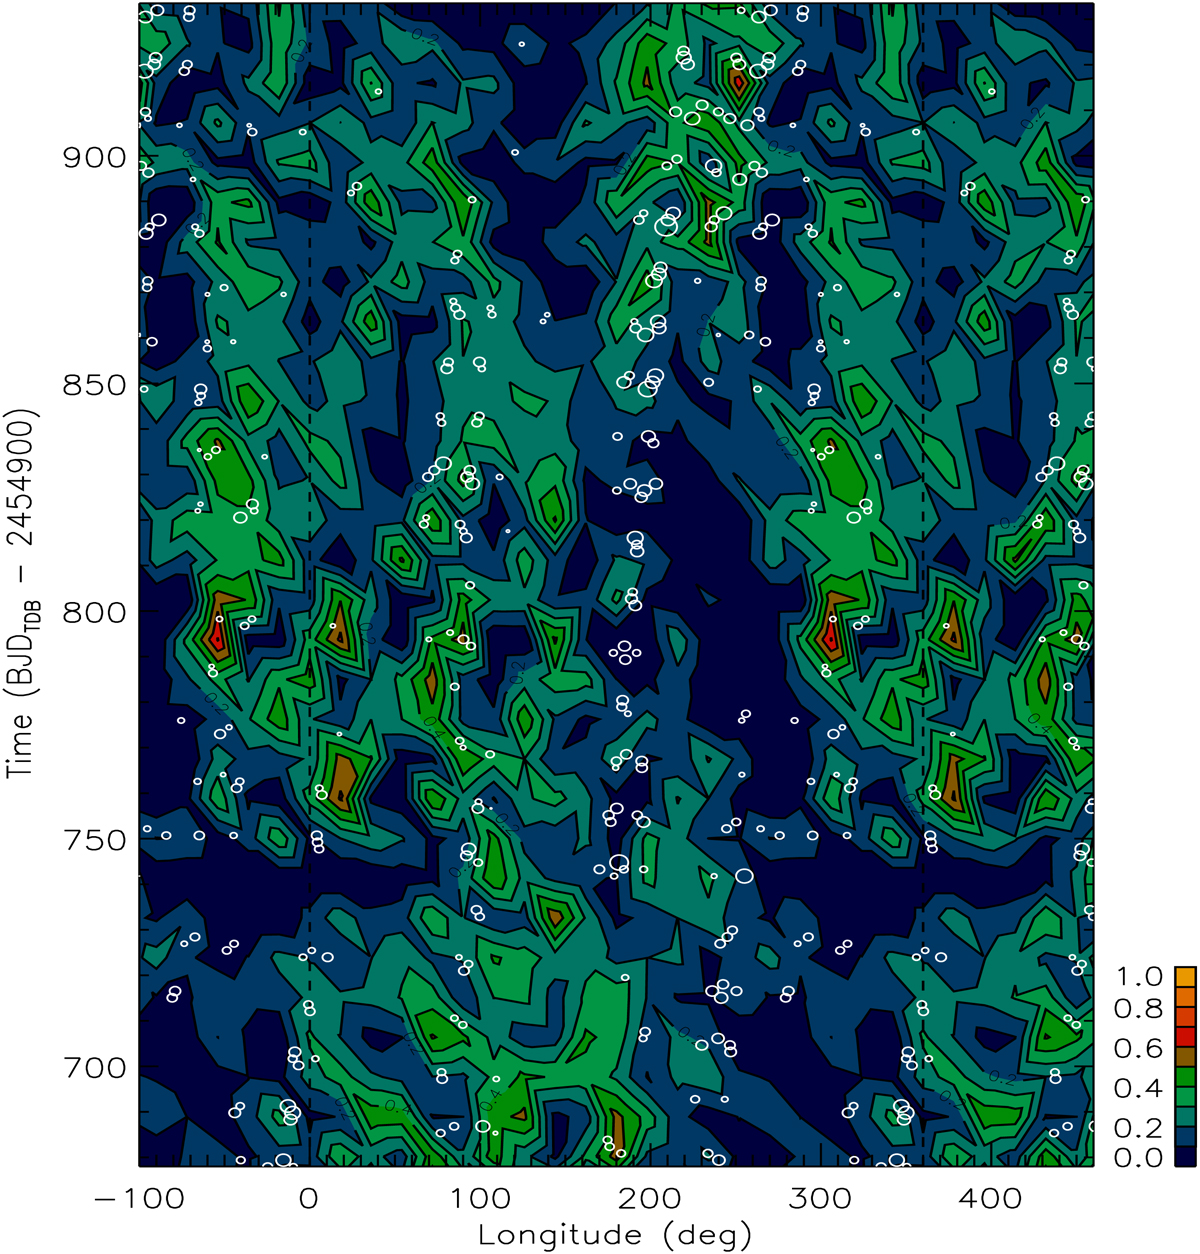
Enlargement of Fig. 10 showing the distribution of the spot filling factor (see the colour scale at the bottom right) vs. longitude and time as obtained by the ME modelling of the light curve de-trended as in Bonomo & Lanza (2012). The spots detected during transits by Valio et al. (2017) are overplotted as white circles the radius of which is proportional to their flux deficit D as defined in Sect. 5.2. The longitude scale goes beyond the interval [0° ,360°] to help us following the migration of the spots.
Current usage metrics show cumulative count of Article Views (full-text article views including HTML views, PDF and ePub downloads, according to the available data) and Abstracts Views on Vision4Press platform.
Data correspond to usage on the plateform after 2015. The current usage metrics is available 48-96 hours after online publication and is updated daily on week days.
Initial download of the metrics may take a while.