Free Access
Fig. A.6.
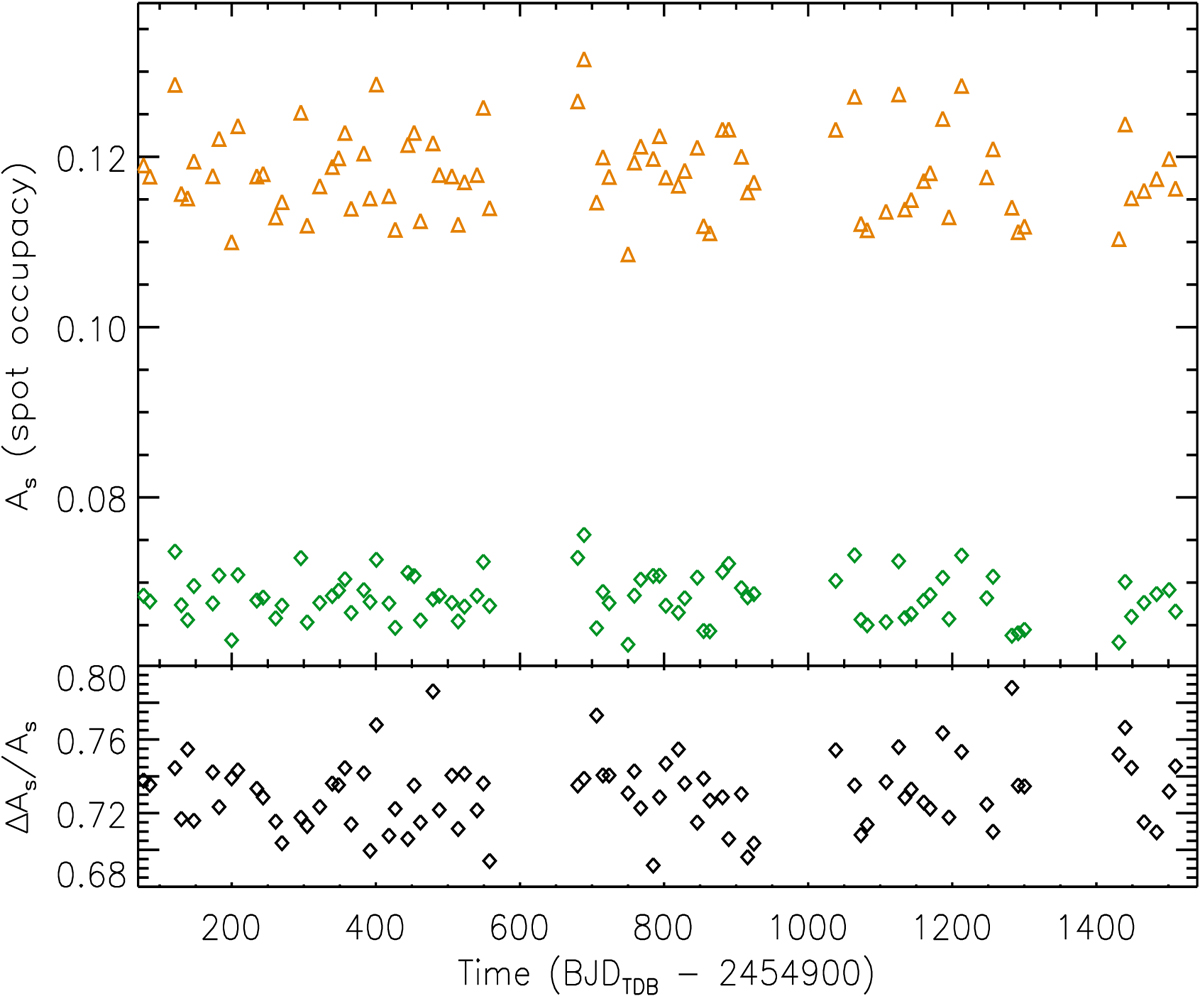
Upper panel: total coverage factor As of the starspots as derived from the ME models of the light curve of Bonomo & Lanza with cs = 0.55 (green diamonds) or cs = 0.72 (orange triangles). Lower panel: relative difference between the values of the area obtained with the two different spot contrasts.
Current usage metrics show cumulative count of Article Views (full-text article views including HTML views, PDF and ePub downloads, according to the available data) and Abstracts Views on Vision4Press platform.
Data correspond to usage on the plateform after 2015. The current usage metrics is available 48-96 hours after online publication and is updated daily on week days.
Initial download of the metrics may take a while.