Free Access
Fig. 16.
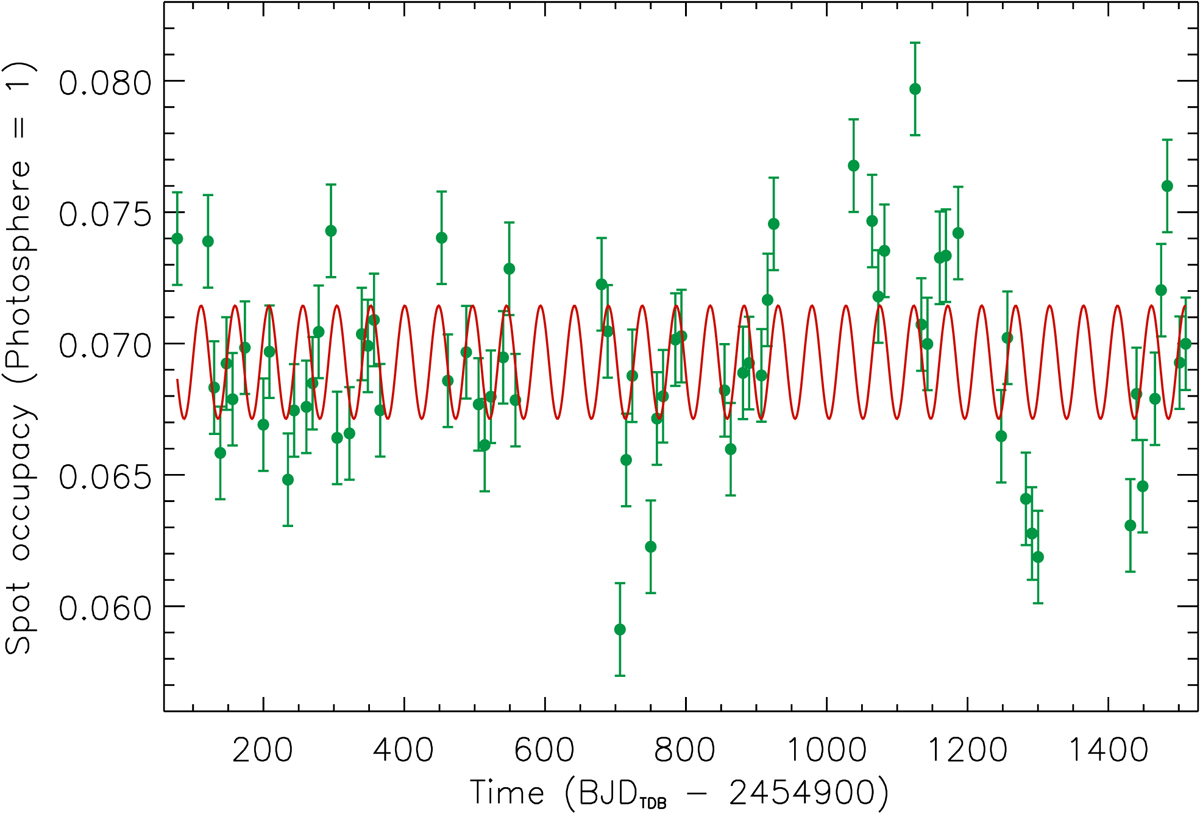
As in Fig. 13, but for the area values derived by the ME best fit to the ARC2 light curve. Intervals with δ > 0.25 have been discarded. The period of the GLS best fitting sinusoid is 48.202 days. We highlight the different scale on the y-axis.
Current usage metrics show cumulative count of Article Views (full-text article views including HTML views, PDF and ePub downloads, according to the available data) and Abstracts Views on Vision4Press platform.
Data correspond to usage on the plateform after 2015. The current usage metrics is available 48-96 hours after online publication and is updated daily on week days.
Initial download of the metrics may take a while.