Free Access
Fig. 15.
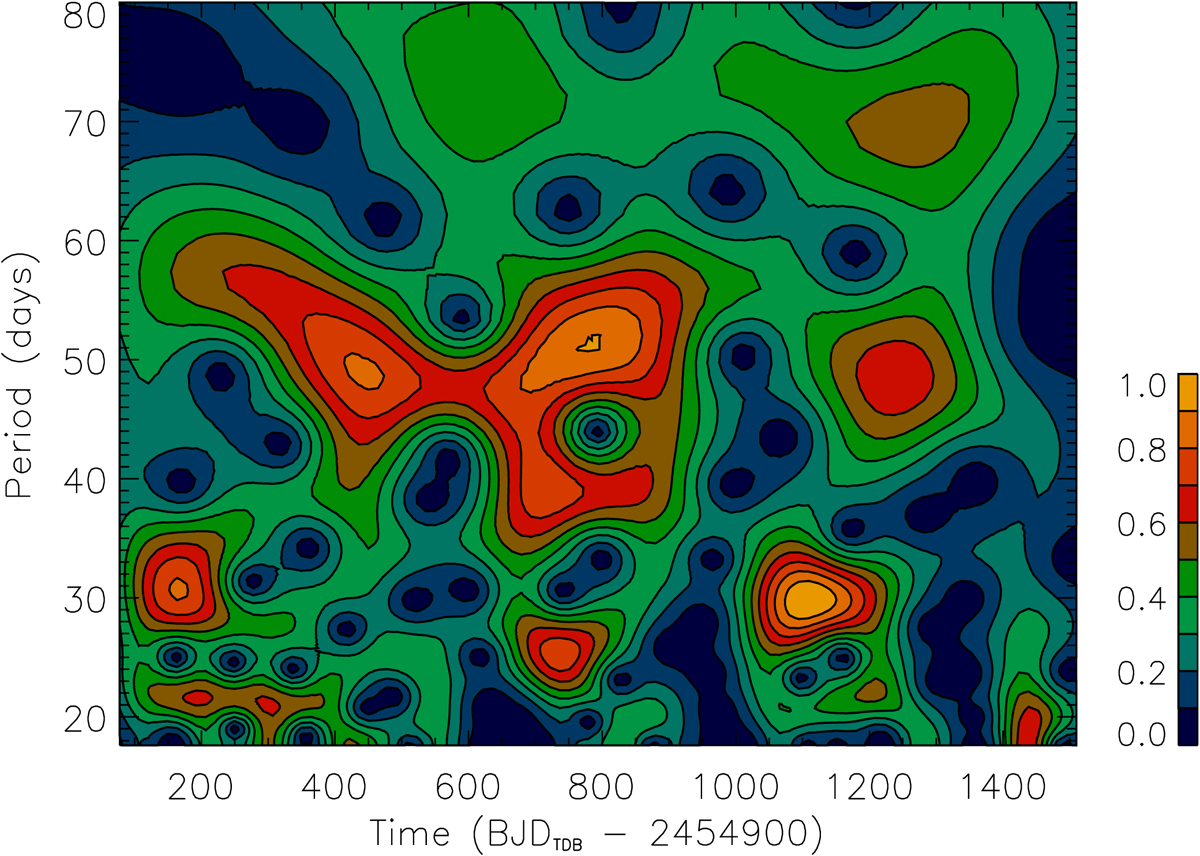
Amplitude of the Morlet wavelet of the total spotted area variation in Fig. 13 vs. period and time. The amplitude was normalized to its maximum value. Different colours indicate different relative amplitudes from the maximum (orange) to the minimum (dark blue) as indicated in the colour scale in the right lower corner.
Current usage metrics show cumulative count of Article Views (full-text article views including HTML views, PDF and ePub downloads, according to the available data) and Abstracts Views on Vision4Press platform.
Data correspond to usage on the plateform after 2015. The current usage metrics is available 48-96 hours after online publication and is updated daily on week days.
Initial download of the metrics may take a while.