Fig. 13.
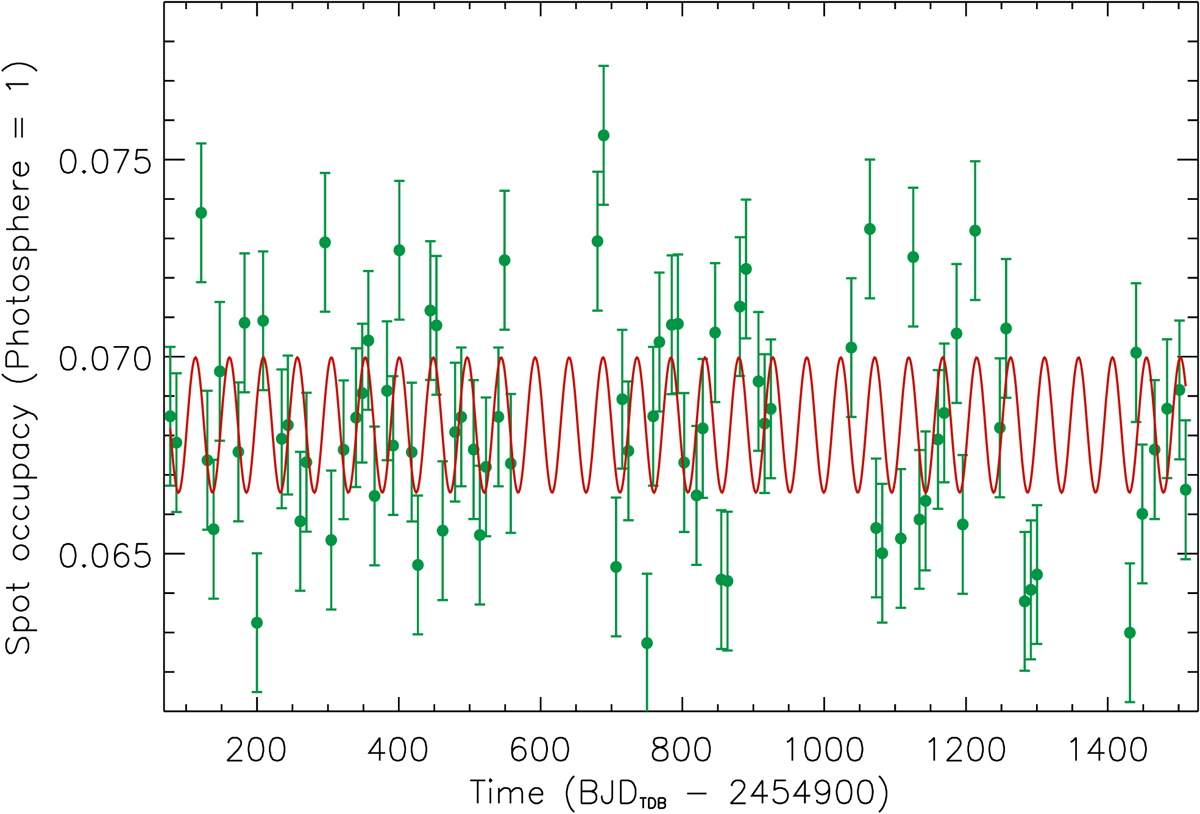
Total spotted area as derived from the ME best fits to the light curve de-trended with the method of Bonomo & Lanza (2012) vs. time (green filled circles). The error bars have an amplitude of 3σ, where σ is the standard deviation as derived from the photometric accuracy of the datapoints. Values for the intervals with δ > 0.2 have been excluded. The best fitting sinusoid with a period of 47.906 days is superposed to the time series (red solid line).
Current usage metrics show cumulative count of Article Views (full-text article views including HTML views, PDF and ePub downloads, according to the available data) and Abstracts Views on Vision4Press platform.
Data correspond to usage on the plateform after 2015. The current usage metrics is available 48-96 hours after online publication and is updated daily on week days.
Initial download of the metrics may take a while.