Fig. 11.
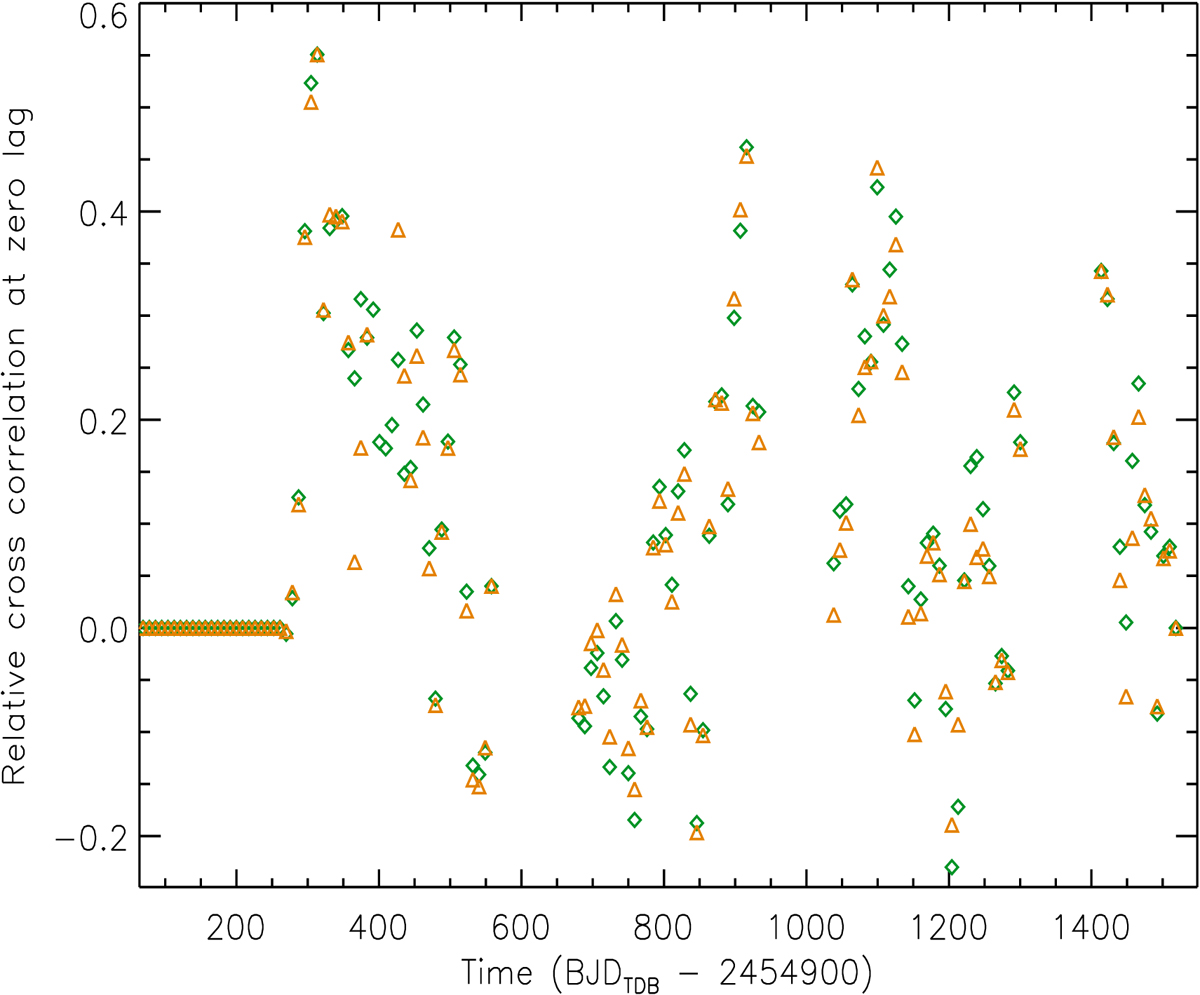
Cross-correlation coefficient at zero lag (see text) between the distributions of the starspots as obtained from the ME models of the out-of-transit light curves and the spots occulted during transits as mapped by Valio et al. (2017). The considered ME spot longitude distributions are those obtained from the light curve of Bonomo & Lanza (green diamonds) and the ARC2 light curve (orange triangles).
Current usage metrics show cumulative count of Article Views (full-text article views including HTML views, PDF and ePub downloads, according to the available data) and Abstracts Views on Vision4Press platform.
Data correspond to usage on the plateform after 2015. The current usage metrics is available 48-96 hours after online publication and is updated daily on week days.
Initial download of the metrics may take a while.