Fig. 1.
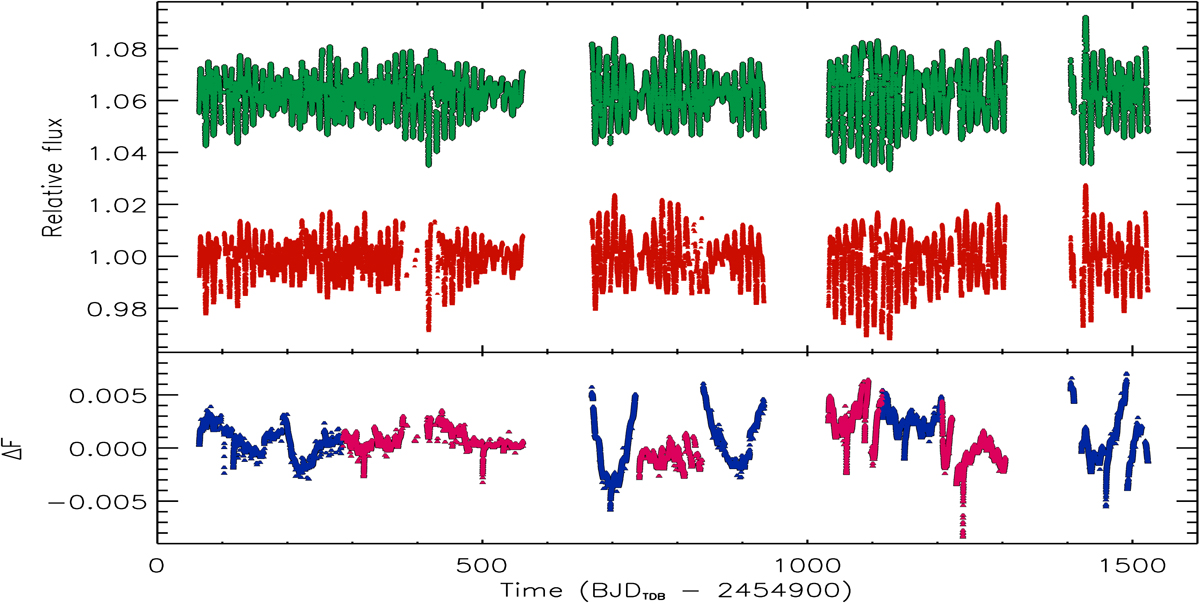
Top panel: light curve of Kepler-17 as obtained by applying the de-trending as in Bonomo & Lanza (2012) (in green) and the light curve as provided by the ARC2 pipeline (in red). Each light curve is normalized to the median flux within each quarter after removing the planetary transits. The green datapoints have been shifted upward by 0.0625 for clarity. Bottom panel: difference between the two light curves. The quarters where only the first CBV has been applied to obtain the ARC2 light curve are indicated with blue datapoints, while the quarters where the first two CBVs have been applied are indicated in pink (see the text).
Current usage metrics show cumulative count of Article Views (full-text article views including HTML views, PDF and ePub downloads, according to the available data) and Abstracts Views on Vision4Press platform.
Data correspond to usage on the plateform after 2015. The current usage metrics is available 48-96 hours after online publication and is updated daily on week days.
Initial download of the metrics may take a while.