Fig. A.1
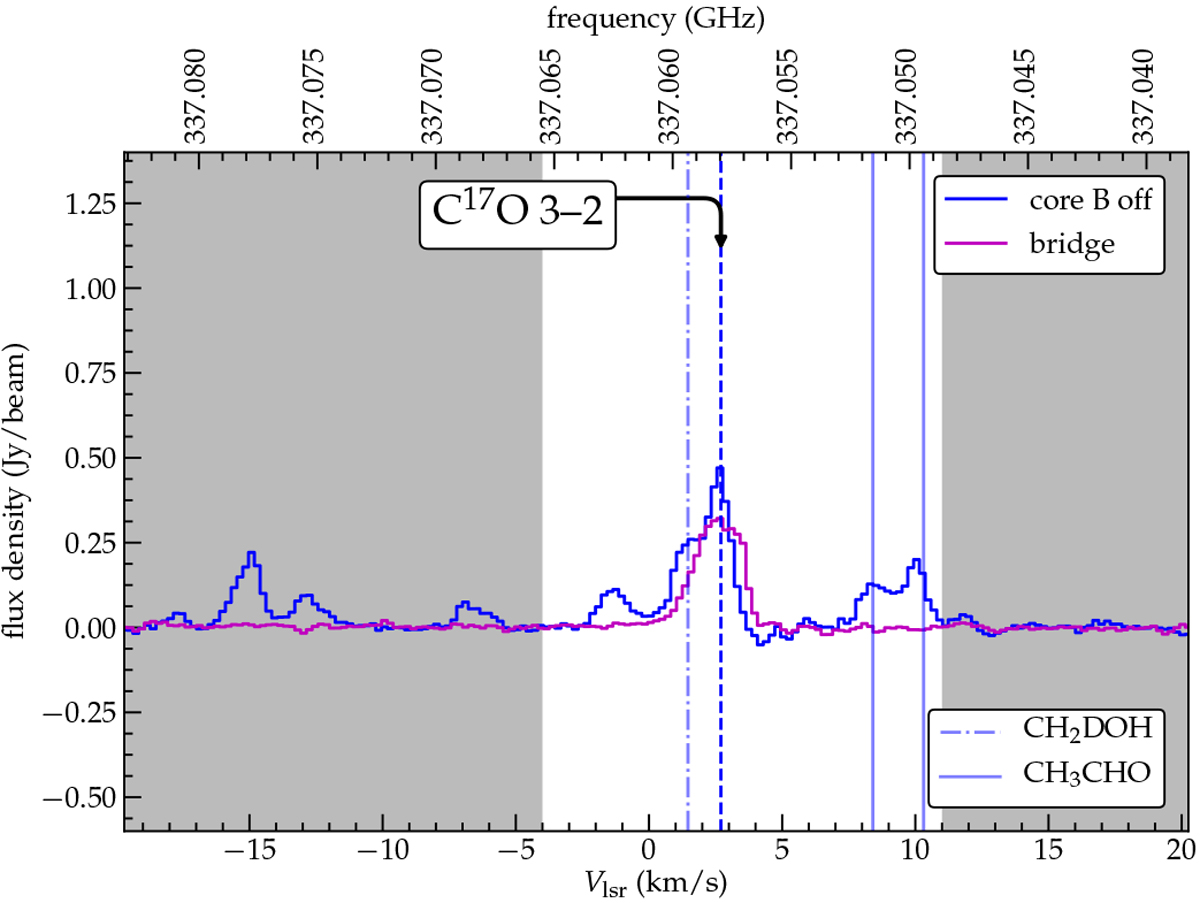
Spectral profiles of C17O 3–2 at two spatial positions: one beam west-southwest of source B (blue “ × ” mark in Fig. 2) and within the bridge filament (magenta “+” mark in the same figure). The frequency of the species of interest is marked by the blue, vertical dashed line; other lines identified in the frequency range are marked with dotted, dash-dotted, or solid lines. All rest frequencies are shifted by + 2.7 km s−1 to account for the systemic velocity of source B. The section of the velocity axis with white background denotes the maximum range over which intensities are integrated.
Current usage metrics show cumulative count of Article Views (full-text article views including HTML views, PDF and ePub downloads, according to the available data) and Abstracts Views on Vision4Press platform.
Data correspond to usage on the plateform after 2015. The current usage metrics is available 48-96 hours after online publication and is updated daily on week days.
Initial download of the metrics may take a while.