Fig. 6
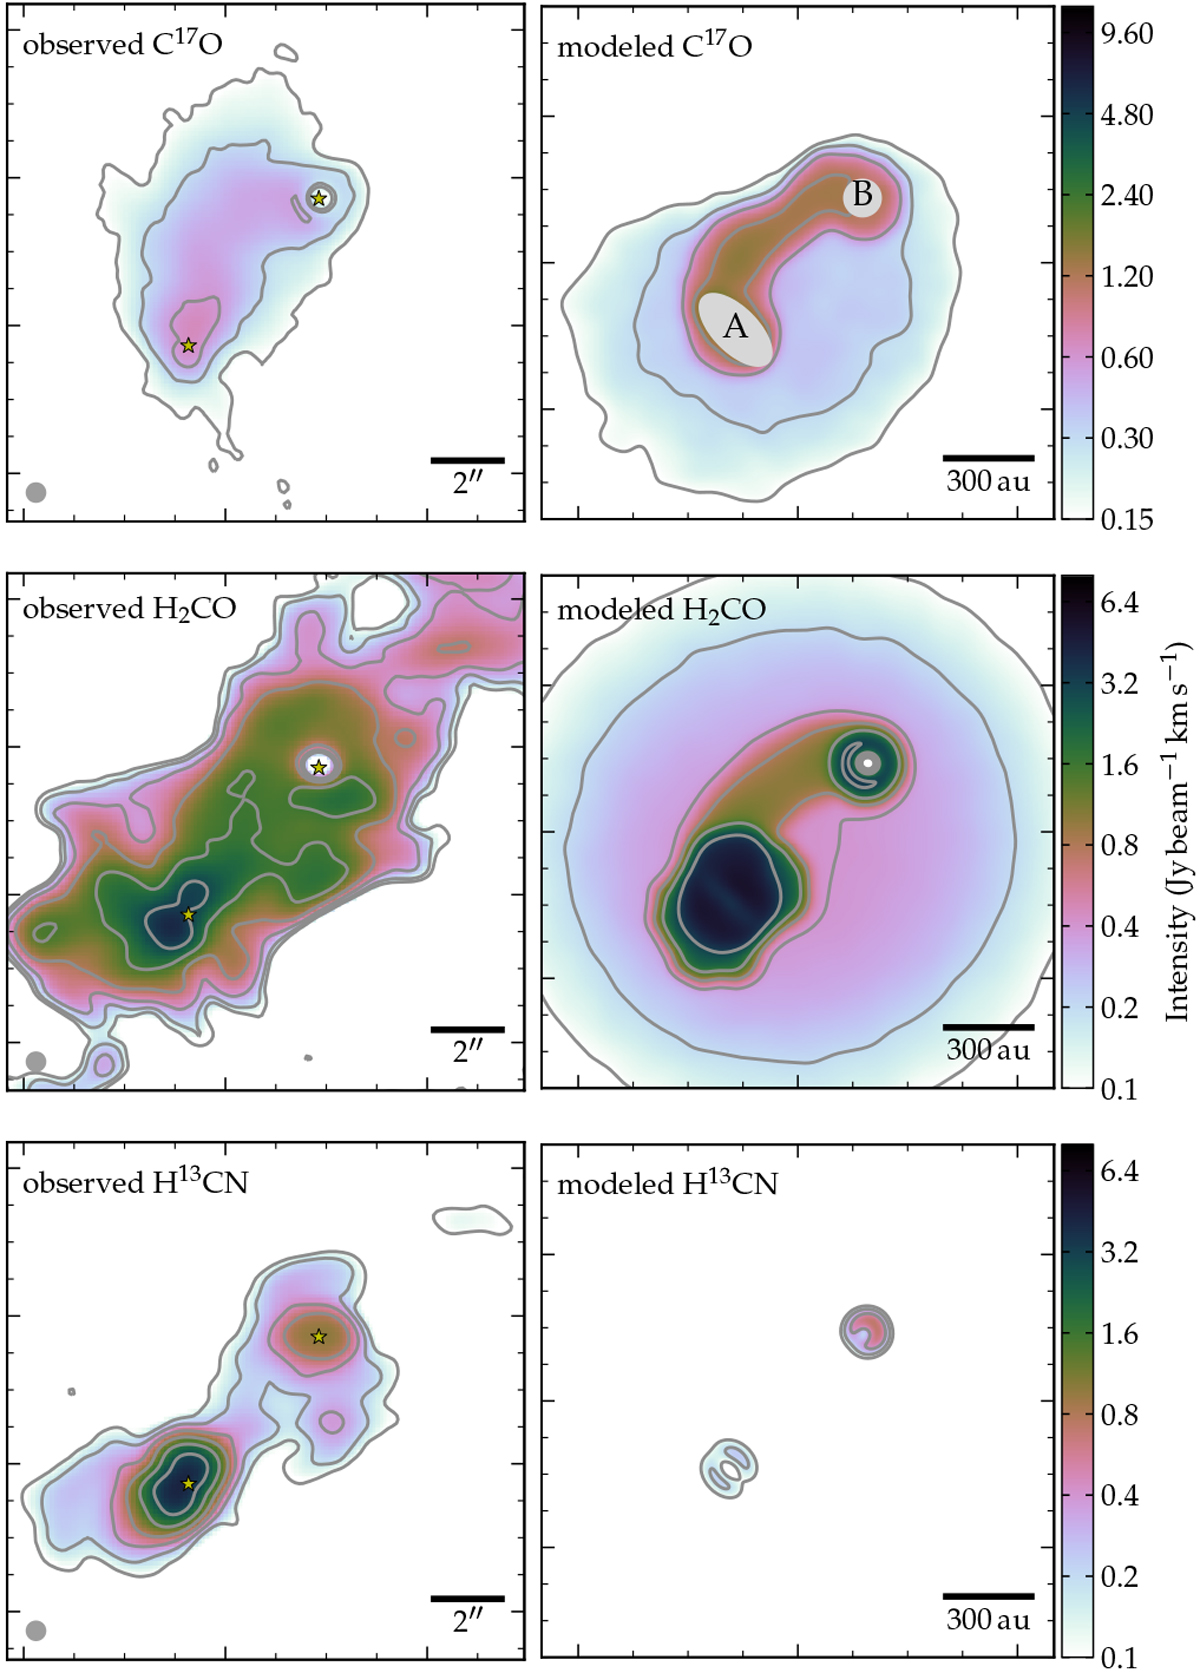
Comparison of observed (left) and modeled (right) morphology of spectral line emission from C17O, H2CO, and H13CN. In the C17O model panel, the disk domains are masked (as in Fig. 2). Total intensity from the observed cubes is calculated by integrating over Vlsr range [ + 2, + 4] km s−1. The continuum peak locations are marked by star symbols, the ALMA interferometric beam size is indicated in the bottom left of each “observed” panel. The modeled line intensity maps are convolved with the observational beam size, to aid direct comparison. Line intensity is represented by the color scale and gray contours (identical for observed and modeled panels: lowest level at 0.15 for C17O, 0.10 Jy beam−1 km s−1 for H2CO and H13CN, and increasing by a factor of 2 each level). Black contours indicate the 0.87 mm dust continuum.
Current usage metrics show cumulative count of Article Views (full-text article views including HTML views, PDF and ePub downloads, according to the available data) and Abstracts Views on Vision4Press platform.
Data correspond to usage on the plateform after 2015. The current usage metrics is available 48-96 hours after online publication and is updated daily on week days.
Initial download of the metrics may take a while.