Fig. 5
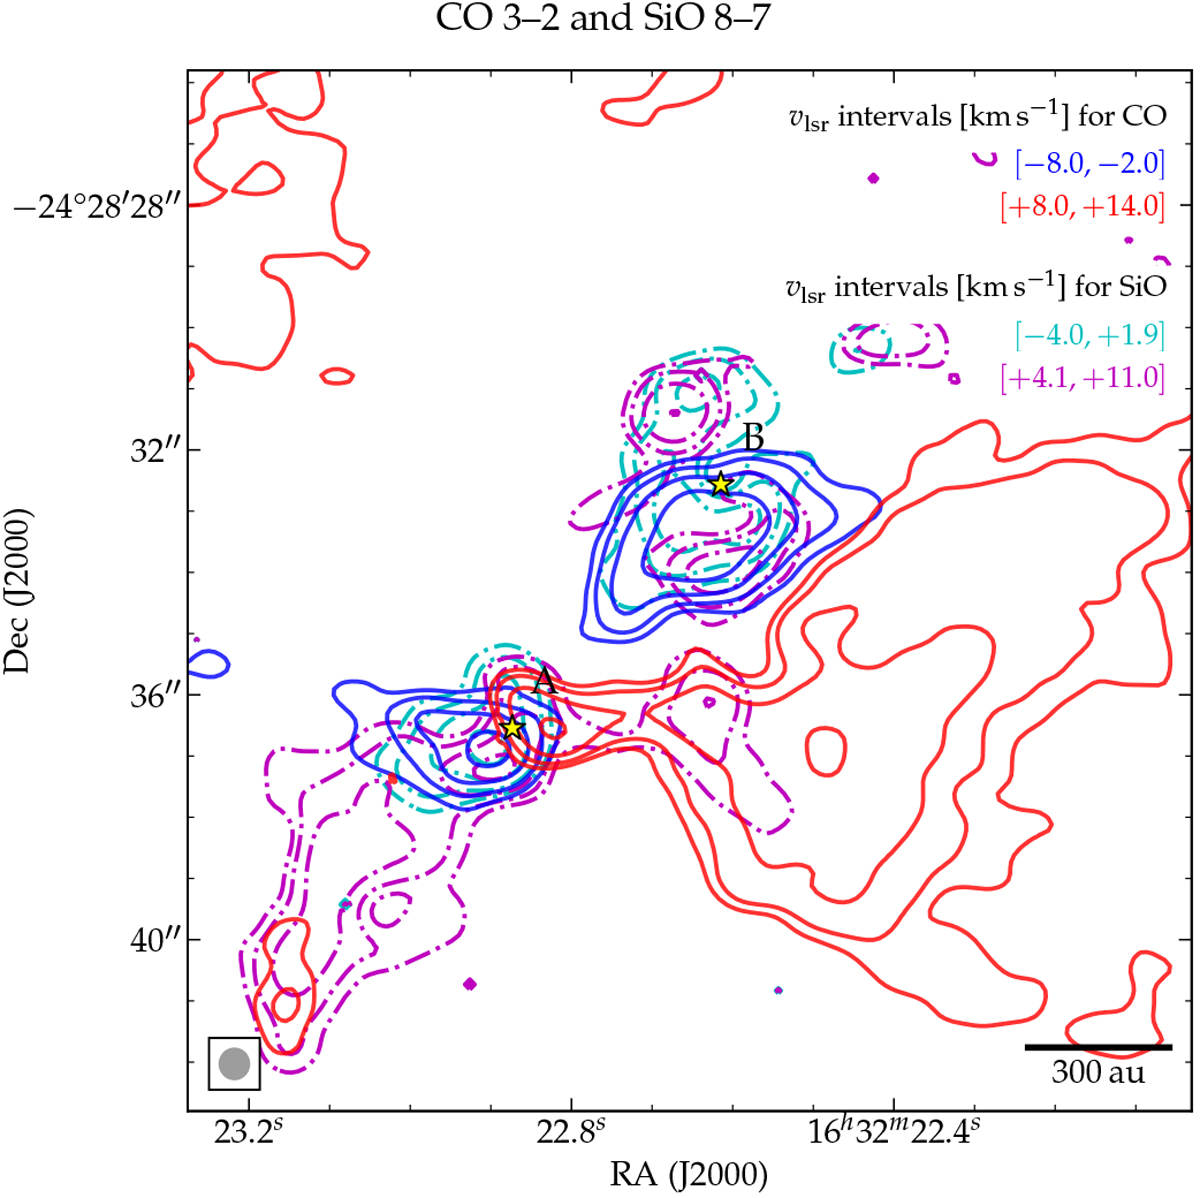
Overlay of the maps of high-velocity CO emission (solid blue and red contours), and non-systemic SiO emission (dash-dotted cyan and magenta contours). The three separate CO velocity bins on either side of the systemic velocity shown in Fig. 4 are collapsed into one bin for this figure (solid blue and red contours). The blueshifted and redshifted SiO emission (dashed cyan and magenta contours) is the same as shown in the bottom left panel of Fig. 3. A linear scale indicator and the size of the synthesized PILS beam are plotted in the bottom right and bottom left corners, respectively.
Current usage metrics show cumulative count of Article Views (full-text article views including HTML views, PDF and ePub downloads, according to the available data) and Abstracts Views on Vision4Press platform.
Data correspond to usage on the plateform after 2015. The current usage metrics is available 48-96 hours after online publication and is updated daily on week days.
Initial download of the metrics may take a while.