Fig. 4
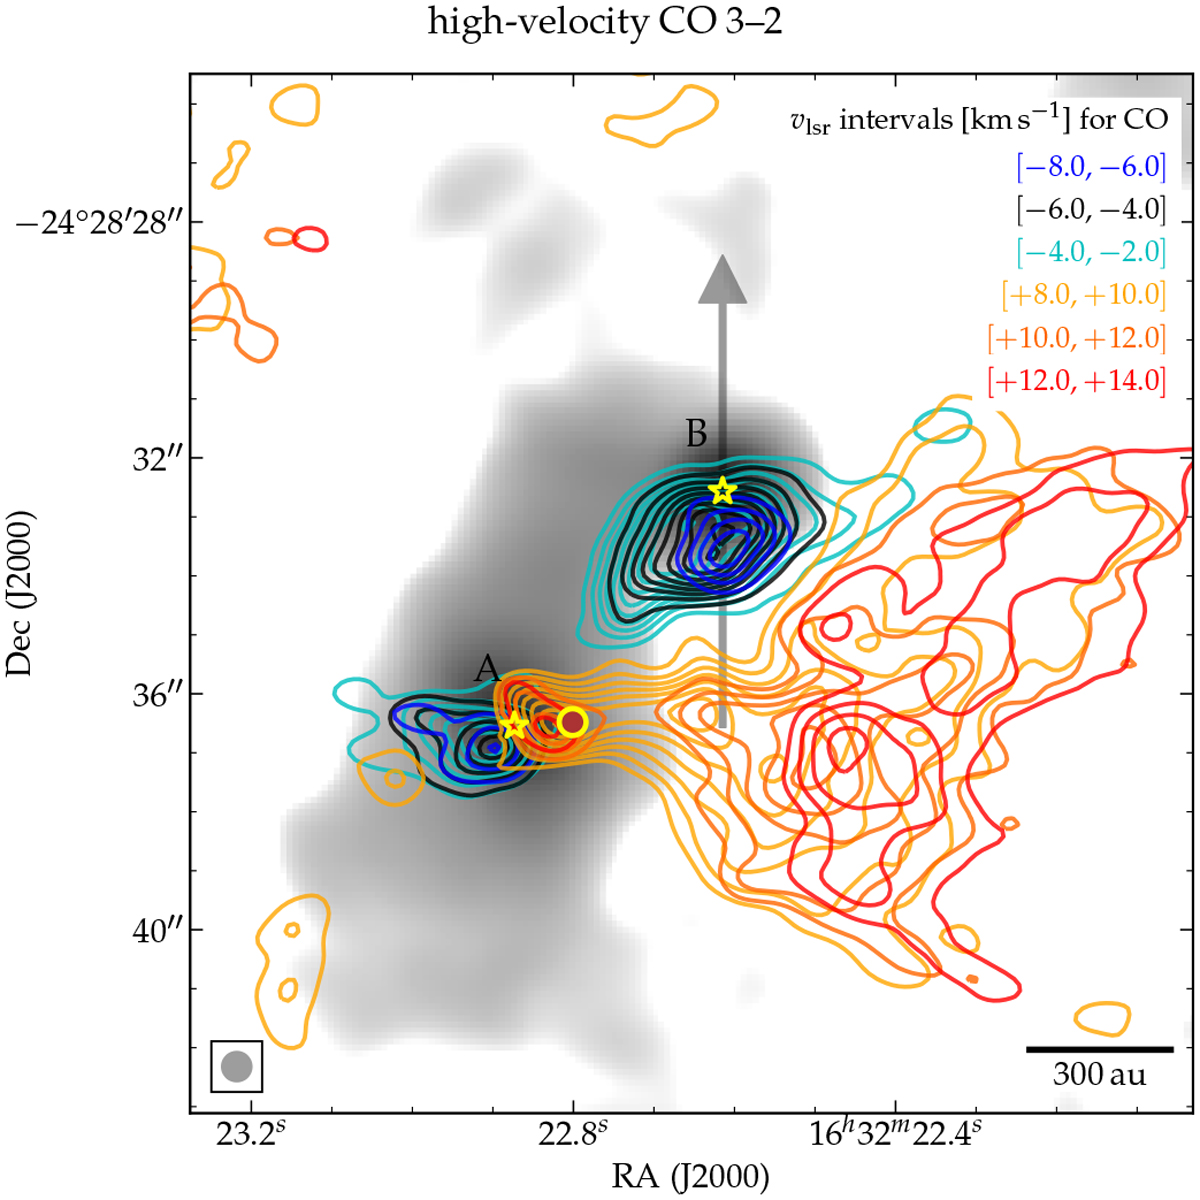
Mapof six different velocity bins of the main CO isotopologue, highlighting high-velocity gas at >5 km s−1 from the systemic velocity (Vlsr ≈ +3 km s−1) of the protostars: absolute velocity difference of [5,7] km s−1 in cyan and orange contours, of [7,9] km s−1 in black and darker orange, and of [9,11] km s−1 in blue and red. The lowest contour level and step to the next contour is 1.0 Jy beam−1 km s−1. The 0.87 mm dust continuum is shown in grayscale. The arrow indicates the slice for the position-velocity diagram shown in Fig. 7. The position of the water maser spot at Vlsr = +6.1 km s−1 (Dzib et al. 2018) is marked with a red circle with a yellow outline, ~1′′ west of source A.A linear scale indicator is plotted in the bottom right corner, and the size of the synthesized PILS beam in the bottom left corner.
Current usage metrics show cumulative count of Article Views (full-text article views including HTML views, PDF and ePub downloads, according to the available data) and Abstracts Views on Vision4Press platform.
Data correspond to usage on the plateform after 2015. The current usage metrics is available 48-96 hours after online publication and is updated daily on week days.
Initial download of the metrics may take a while.