Fig. C.1
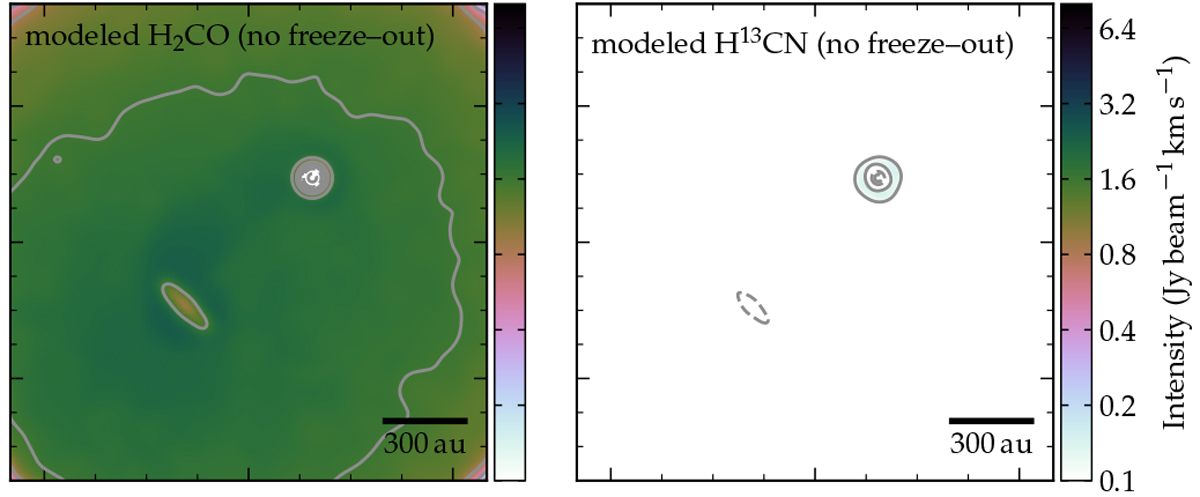
Radiative transfer model maps (see Sect. 4.1) of o-H2CO 51,5–41,4 (left) and H13CN 4–3 (right) with freeze-out effects ignored. These maps are counterparts of the more physically correct ones where freeze-out is implemented, in the middle right and bottom right panels of Fig. 6. Color scales and contours are identical to those used in Fig. 6, with the exception that negative intensity contours (dashed) are included in this figure.
Current usage metrics show cumulative count of Article Views (full-text article views including HTML views, PDF and ePub downloads, according to the available data) and Abstracts Views on Vision4Press platform.
Data correspond to usage on the plateform after 2015. The current usage metrics is available 48-96 hours after online publication and is updated daily on week days.
Initial download of the metrics may take a while.