Fig. 2
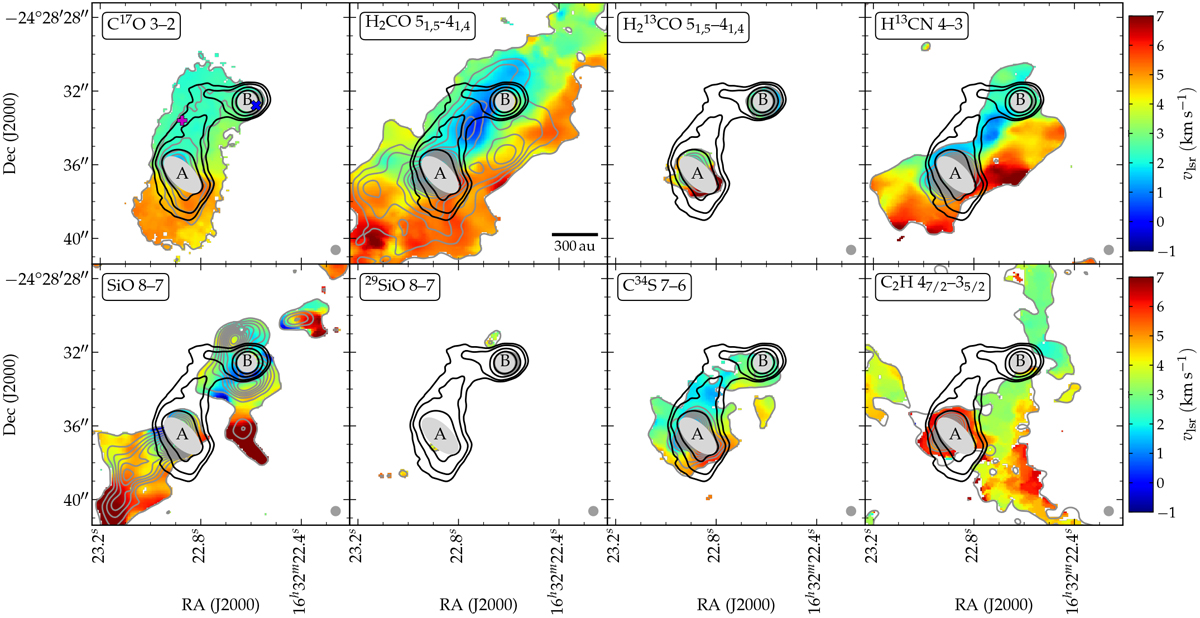
Velocity maps of molecular species listed in Table 2 (except 12C16O, see Fig. 4). Black contours represent 0.87 mm dust continuum at levels of 30, 45, 100, 250 mJy beam−1. Gray contours for integrated spectral line intensity start at 0.35 Jy beam−1 km s−1, and velocity values are only shown where the integrated intensity is above this threshold. The threshold for C2H is 0.07 Jy beam−1 km s−1, to reflect its narrower integration range ([ − 1, +7] instead of [ − 4, +11] km s−1); it is 0.20 Jy beam−1 km s−1 for 29SiO. Higher level integrated line intensity contours (also in gray) cover 14 linear steps up to the maximum intensity in each map (in units of Jy beam−1 km s−1): 5.62 for C17O, 21.67 for H2CO, 8.10 for H213CO, 32.55 for H13CN, 13.23 for SiO, 2.91 for 29SiO, 6.54 for C34S, and 6.02 for C2H. For comparison with the contour levels: typical rms noise levels in emission-free regions of the integrated intensity maps are 0.03–0.06 Jy beam−1 km s^−1. Velocities between +7 and +11 km s−1 are represented by the darkest red color, and velocities between − 4 and − 1 km s−1 by the darkest blue color. The circular synthesized beam of 0.5′′ in FWHM is indicated in the bottom right of all panels, except the H2CO panel, which features a scale bar representative of 300 au at the source distance of 120 pc. The blue “ × ” sign in the top left panel marks the position 0.5′′ southwest of the continuum peak of source B, often used to extract signals of complex organic molecules (e.g., Coutens et al. 2016; Lykke et al. 2017; Ligterink et al. 2017). The magenta “+” sign marks the position at which the representative bridge filament spectral profiles are extracted (see Appendix A).
Current usage metrics show cumulative count of Article Views (full-text article views including HTML views, PDF and ePub downloads, according to the available data) and Abstracts Views on Vision4Press platform.
Data correspond to usage on the plateform after 2015. The current usage metrics is available 48-96 hours after online publication and is updated daily on week days.
Initial download of the metrics may take a while.