Fig. B.1
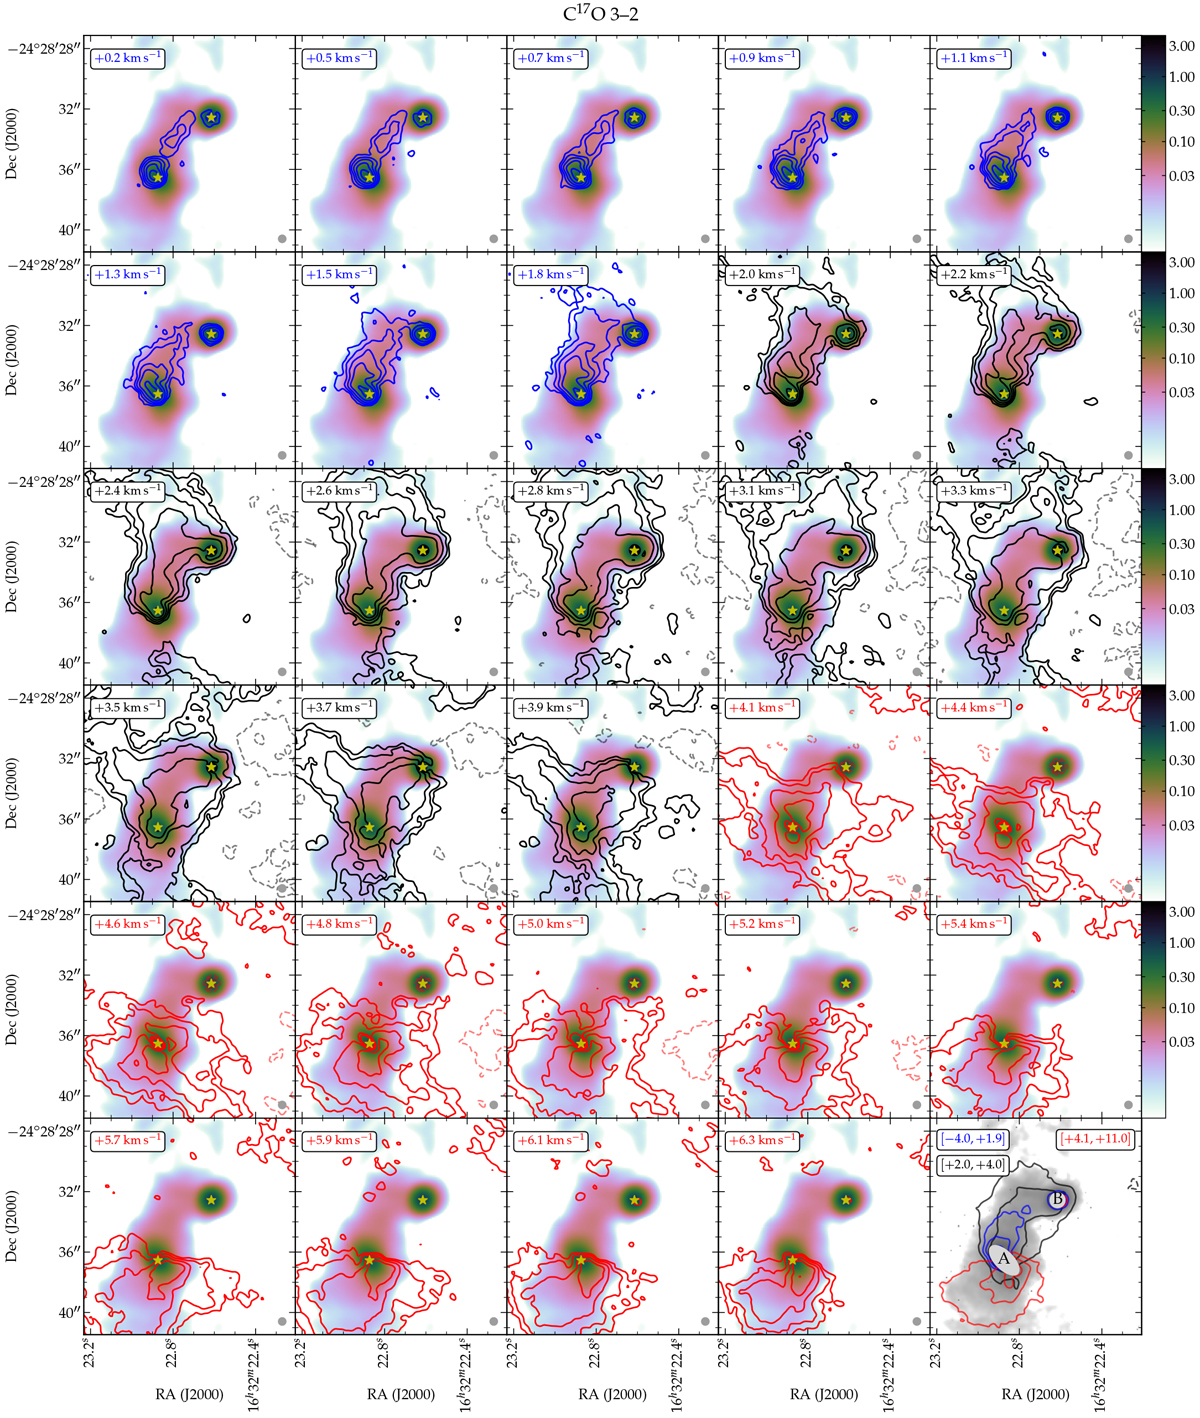
C17O 3–2 channel maps with contours representing logarithmically spaced line intensity in each channel. The first positive contour (solid blue, black, or red) is at 0.03 Jy beam−1, the first negative contour (lighter, dashed) is at − 0.06 Jy beam−1, with every next contour level spaced by a factor of two. The bottom right panel displays three integrated velocity ranges in colored contours: all “blue” channels, [ − 4.0, + 2.0⟩ km s −1 ; all “systemic velocity” channels, [+2.0, +4.0] km s−1; and all “red” channels, ⟨+4.0, +11.0] km s−1. For each of these three, the first contour level is at 0.2 Jy beam−1 km s−1 and levels increase by factors of two, and equivalently for negative contours displayed in dashed line format. Gray scale in bottom right panel (logarithmic stretch from 0.002 to 2.0 Jy beam−1), color scale in all other panels (logarithmic stretch indicated in color bar): 0.87 mm continuum. Star symbols mark the continuum peak locations of protostars A and B (see Table 1).
Current usage metrics show cumulative count of Article Views (full-text article views including HTML views, PDF and ePub downloads, according to the available data) and Abstracts Views on Vision4Press platform.
Data correspond to usage on the plateform after 2015. The current usage metrics is available 48-96 hours after online publication and is updated daily on week days.
Initial download of the metrics may take a while.