Fig. 1
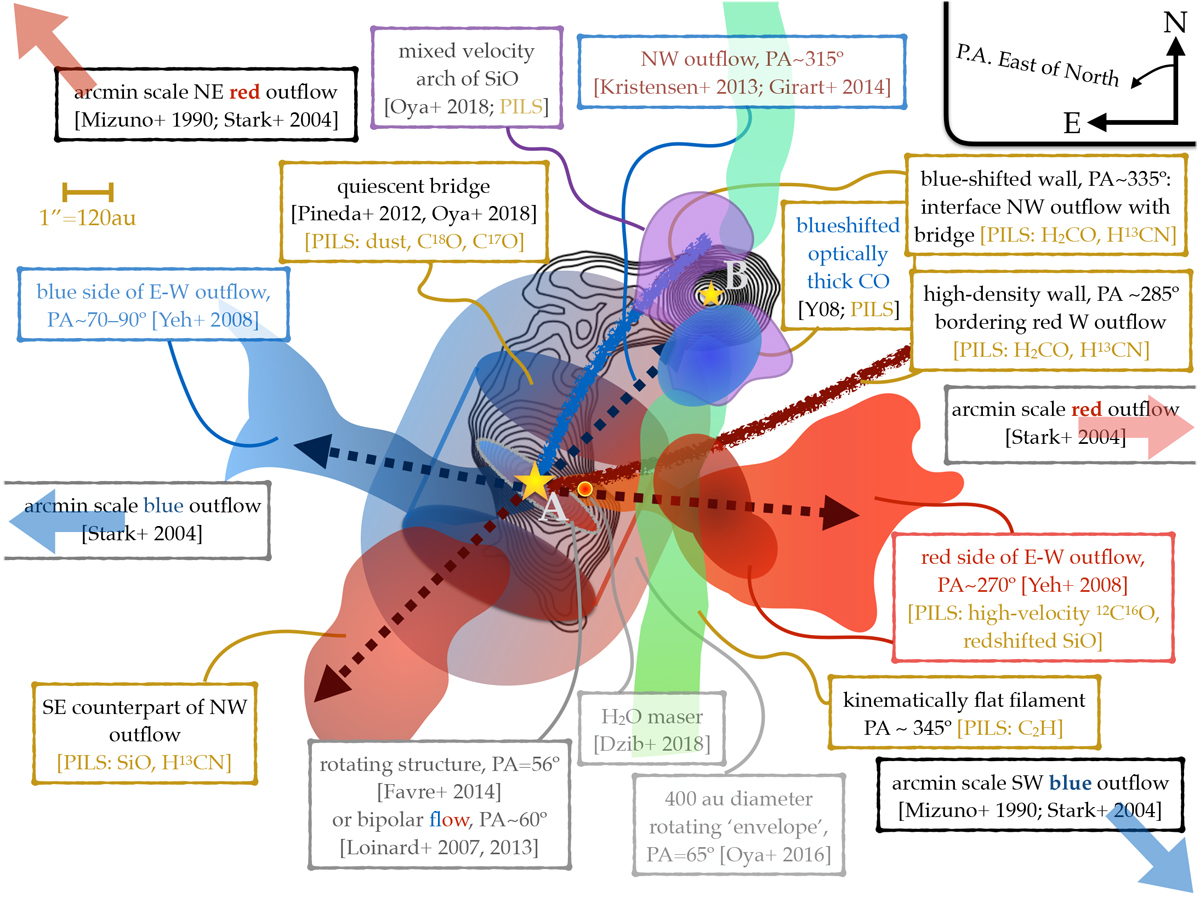
Illustration of physical components surrounding and bridging protostars A and B in the IRAS 16293 system, and outflows emanating from IRAS 16293A. Thick, solid arrows at the edges of the panel point to scales beyond the ~20′′ depicted in this illustration. Position angle (PA) is defined from north to east, as indicated in the top right. Each component is labeled by a rectangular box, with literature sources listed in square brackets. In all references given in square brackets in the illustration, “et al.” is abbreviated as “+”: Dzib et al. (2018), Girart et al. (2014), Kristensen et al. (2013), Loinard et al. (2007, 2013), Mizuno et al. (1990), Oya et al. (2016, 2018), Stark et al. (2004), Yeh et al. (2008) (further abbreviatedas “Y08” where needed); “PILS” refers to structures observed in ALMA PILS observations (Jørgensen et al. 2016; J2018; and this work).
Current usage metrics show cumulative count of Article Views (full-text article views including HTML views, PDF and ePub downloads, according to the available data) and Abstracts Views on Vision4Press platform.
Data correspond to usage on the plateform after 2015. The current usage metrics is available 48-96 hours after online publication and is updated daily on week days.
Initial download of the metrics may take a while.