Fig. 9
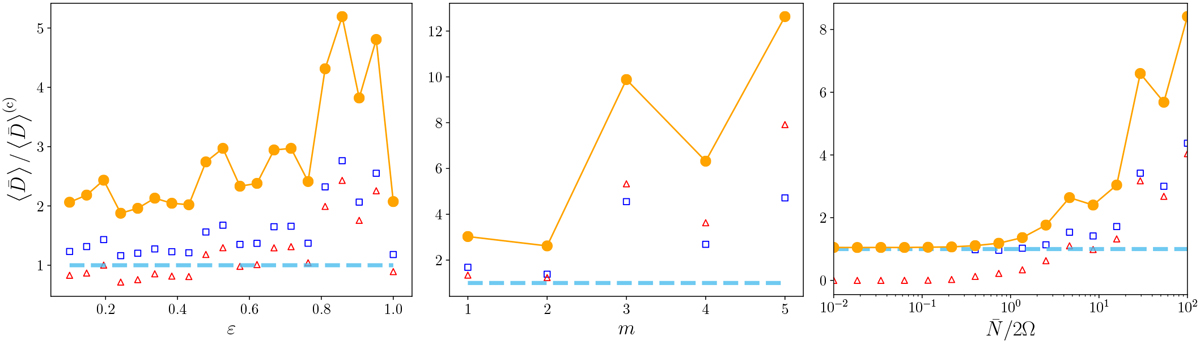
Frequency-averaged dissipation rates as a function of the aspect ratio (left), of the number of steps (middle), and of the ratio ![]() (right), using vertically periodic boundary conditions. These results were obtained for one stably stratified interface and E = K = 10−5. In each panel the orange filled circles correspond to the total dissipation rate, while its viscous and thermal contributions are represented by the empty red triangles and blue squares, respectively. On the y-axis, the frequency-averaged dissipation rates in the layered case,
(right), using vertically periodic boundary conditions. These results were obtained for one stably stratified interface and E = K = 10−5. In each panel the orange filled circles correspond to the total dissipation rate, while its viscous and thermal contributions are represented by the empty red triangles and blue squares, respectively. On the y-axis, the frequency-averaged dissipation rates in the layered case, ![]() , is normalised by the frequency-averaged dissipation rate of the fully convective case,
, is normalised by the frequency-averaged dissipation rate of the fully convective case, ![]() , which is indicated by the horizontal blue dashed line. We adopted a forcing amplitude that is proportional to ω for these calculations.
, which is indicated by the horizontal blue dashed line. We adopted a forcing amplitude that is proportional to ω for these calculations.
Current usage metrics show cumulative count of Article Views (full-text article views including HTML views, PDF and ePub downloads, according to the available data) and Abstracts Views on Vision4Press platform.
Data correspond to usage on the plateform after 2015. The current usage metrics is available 48-96 hours after online publication and is updated daily on week days.
Initial download of the metrics may take a while.