Open Access
Fig. 6
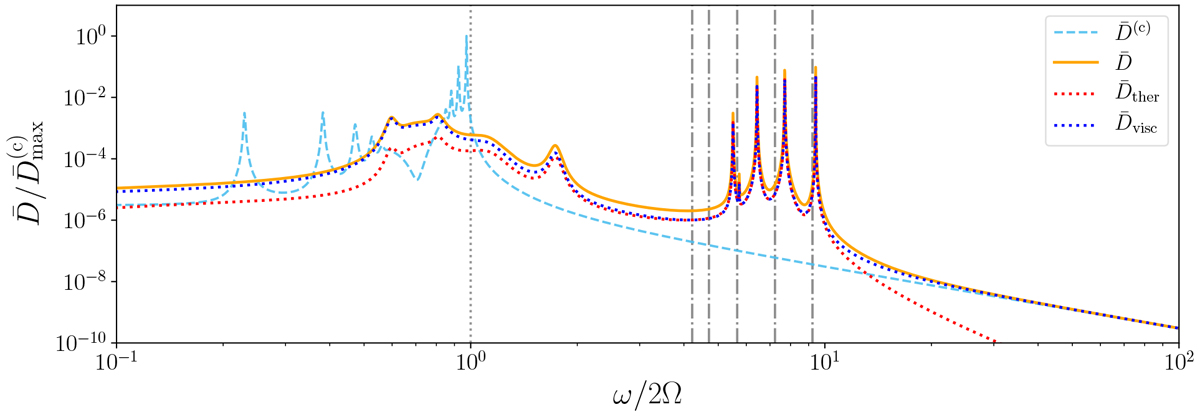
Sameas the bottom panel of Fig. 5, but using rigid boundary conditions in the case with m = 5 and ε = 0.5. Vertical grey dashed dotted lines indicate the five eigenfrequencies calculated from Eq. (50). The vertical dotted lined at ω = 2Ω indicates the upper limit of the sub-inertial frequency range.
Current usage metrics show cumulative count of Article Views (full-text article views including HTML views, PDF and ePub downloads, according to the available data) and Abstracts Views on Vision4Press platform.
Data correspond to usage on the plateform after 2015. The current usage metrics is available 48-96 hours after online publication and is updated daily on week days.
Initial download of the metrics may take a while.