Fig. 5
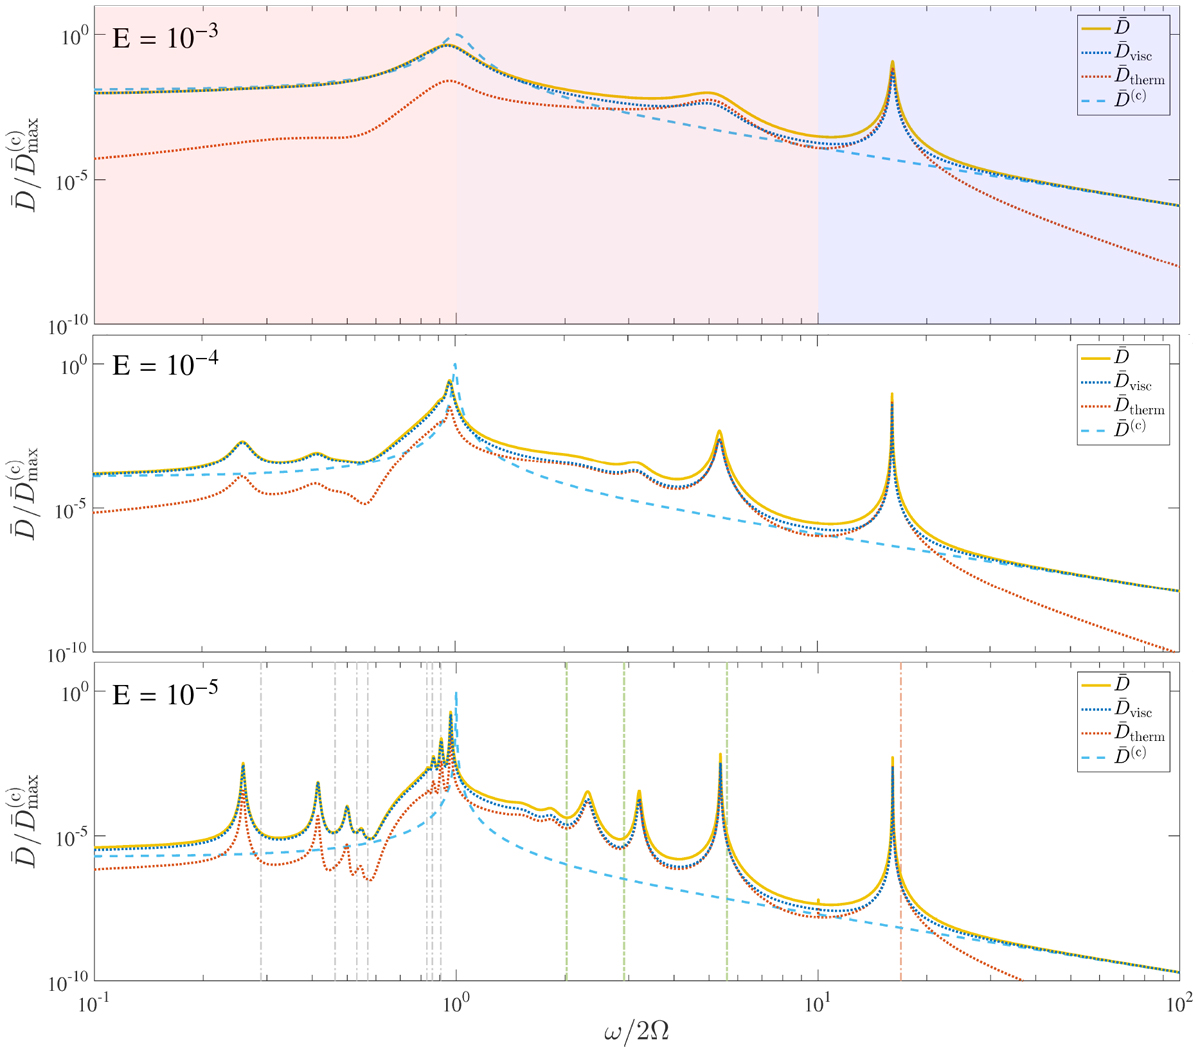
Dissipation spectra with periodic boundary conditions for a single interface with three different diffusivities (Ekman numbers), E = K = 10−3 (top), 10−4 (middle), and 10−5 (bottom), and an aspect ratio ε = 0.2. The total dissipation is represented by the solid orange line, and its viscous and thermal contributions are represented by the dotted blue and red lines, respectively. The dashed light blue line represents the spatially averaged dissipation for a fully convective medium, ![]() . For each panel, the quantity represented is
. For each panel, the quantity represented is ![]() , where
, where ![]() as a functionof the normalised frequency ω∕2Ω. In the bottom panel the vertical dash-dotted lines indicate the position of characteristic frequencies discussed in Sect. 3.2 (from left to right): resonance with short-wavelength inertial modes (in grey), resonances with short-wavelength super-inertial gravito-inertial modes (in green), and resonance with a free gravity mode of the staircase (in light red).
as a functionof the normalised frequency ω∕2Ω. In the bottom panel the vertical dash-dotted lines indicate the position of characteristic frequencies discussed in Sect. 3.2 (from left to right): resonance with short-wavelength inertial modes (in grey), resonances with short-wavelength super-inertial gravito-inertial modes (in green), and resonance with a free gravity mode of the staircase (in light red).
Current usage metrics show cumulative count of Article Views (full-text article views including HTML views, PDF and ePub downloads, according to the available data) and Abstracts Views on Vision4Press platform.
Data correspond to usage on the plateform after 2015. The current usage metrics is available 48-96 hours after online publication and is updated daily on week days.
Initial download of the metrics may take a while.