Open Access
Fig. 3.
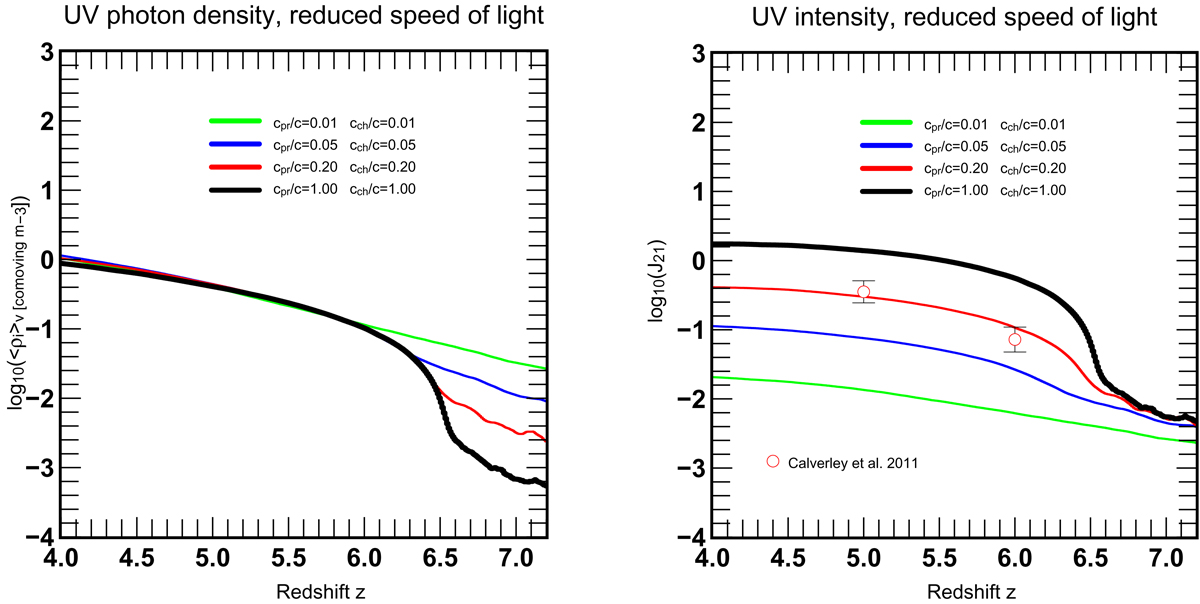
Volume-averaged ionizing photon density (left) and ionizing intensity (right) for our 4 RSL runs. We note how similar post-reionization ionizing photon densities between the runs translate into different ionizing intensities due to the RSL approximation.
Current usage metrics show cumulative count of Article Views (full-text article views including HTML views, PDF and ePub downloads, according to the available data) and Abstracts Views on Vision4Press platform.
Data correspond to usage on the plateform after 2015. The current usage metrics is available 48-96 hours after online publication and is updated daily on week days.
Initial download of the metrics may take a while.