Fig. 8.
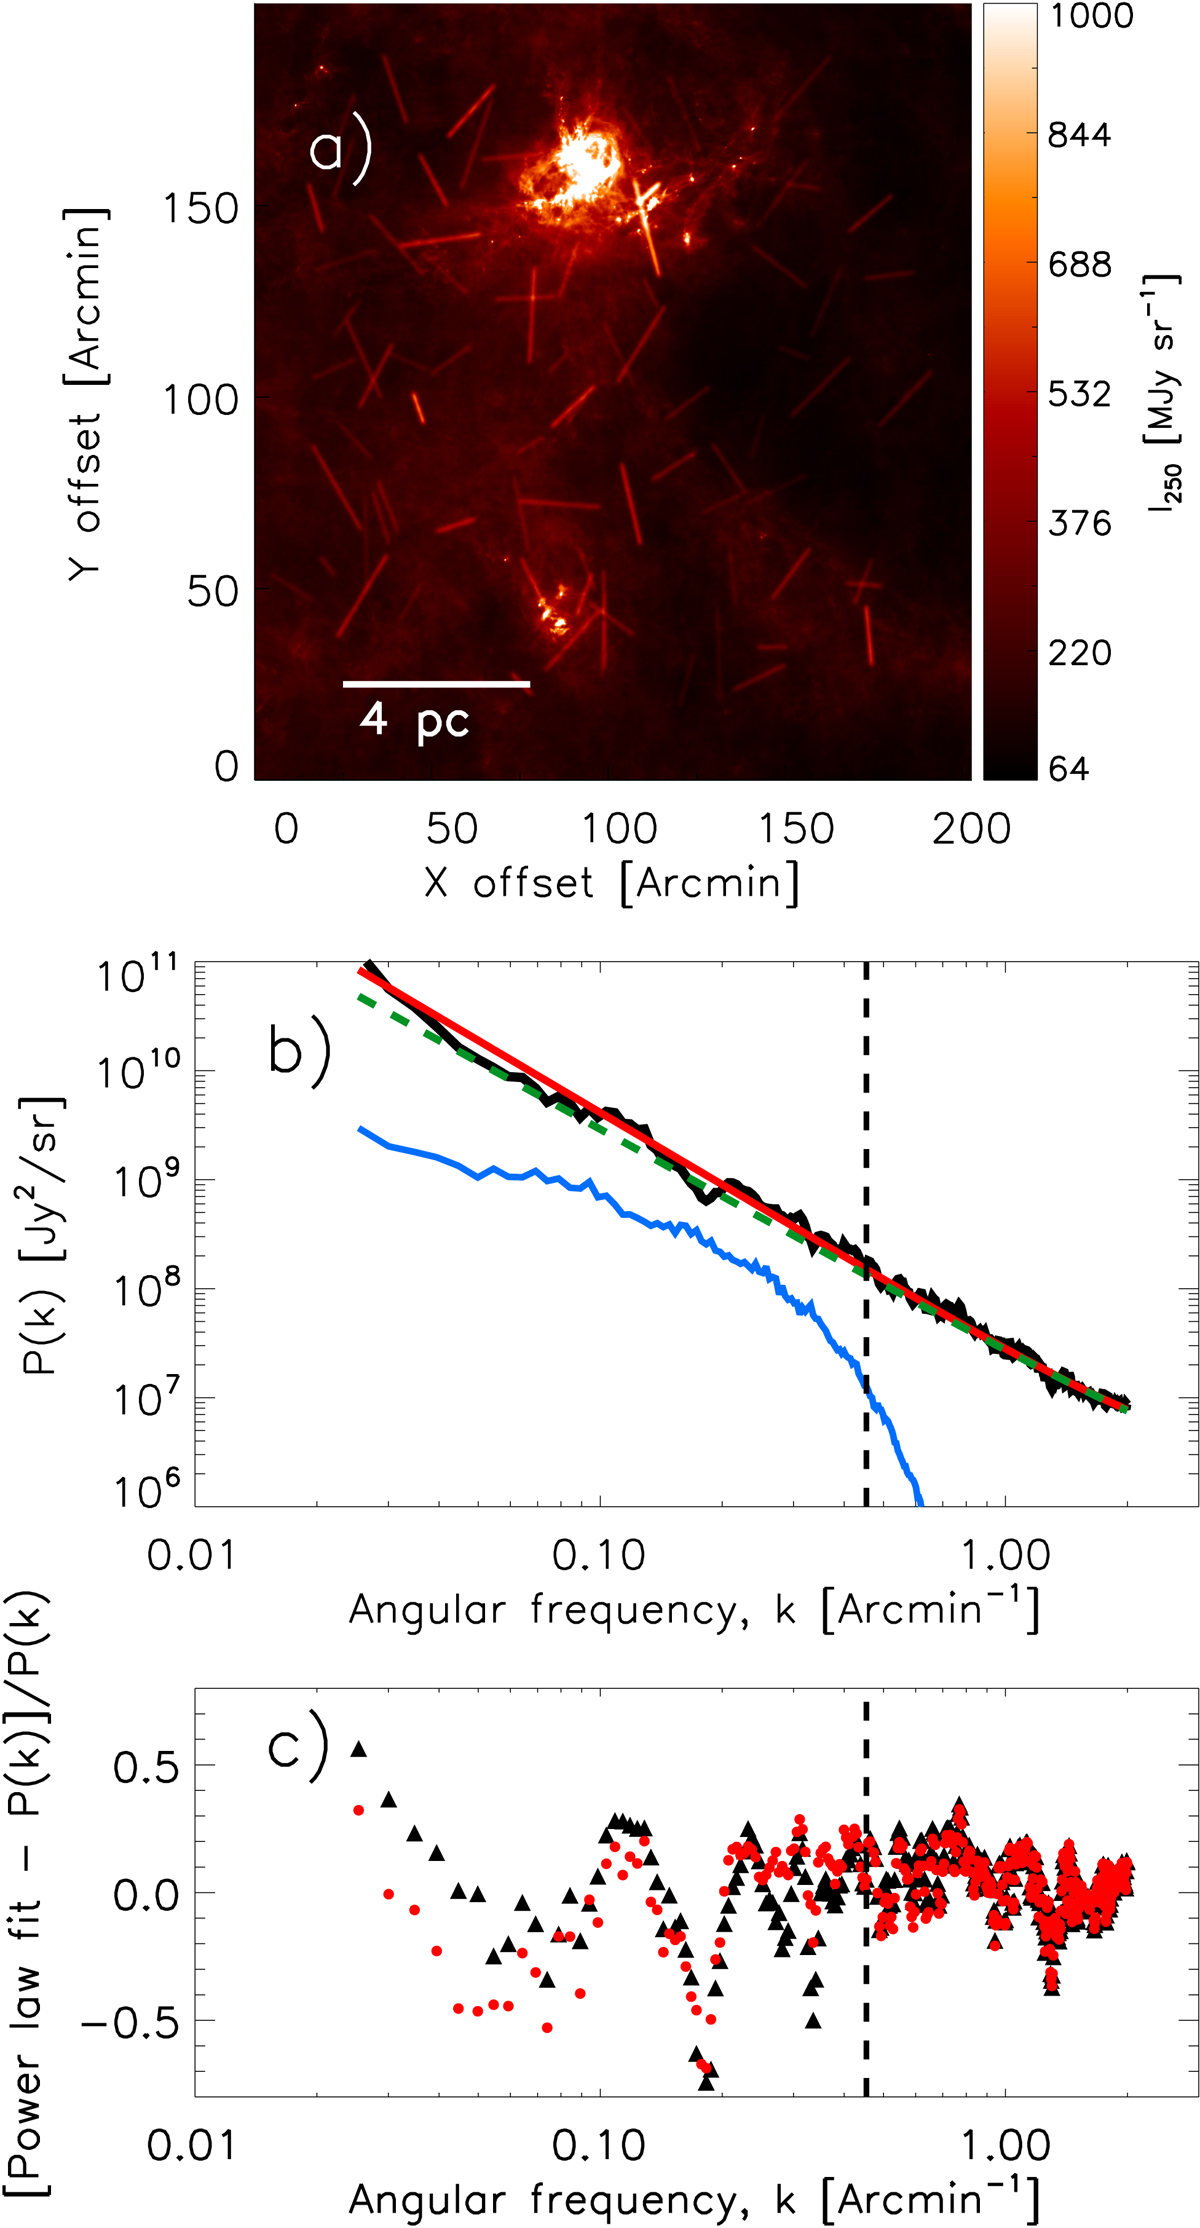
Same as Fig. 6 but for a simulated image including a population of synthetic filaments with a realistic distribution of column density contrasts (see Fig. 7) added to a filament-subtracted image of the Aquila cloud. Panel a: simulated image. The weighted average contrast ⟨δc⟩ of the distribution of synthetic filaments is 0.96 and the total area covering factor Afil is 5.5%, leading to ![]() Afil ∼ 0.051. Panel b: power spectrum of the simulated image (black solid curve). The red curve corresponds to the best power-law fit with γ = −2.3 ± 0.1. For comparison, the best power-law fit to the power spectrum of the Aquila original image is over-plotted as a green dashed line. Panel c: residuals between the best power-law fit and the power spectrum of the simulated image (red solid circles). The
Afil ∼ 0.051. Panel b: power spectrum of the simulated image (black solid curve). The red curve corresponds to the best power-law fit with γ = −2.3 ± 0.1. For comparison, the best power-law fit to the power spectrum of the Aquila original image is over-plotted as a green dashed line. Panel c: residuals between the best power-law fit and the power spectrum of the simulated image (red solid circles). The ![]() of the residuals is ∼0.054 For comparison, the black filled triangles show similar residuals for the Aquila original image (cf. Fig. 6c).
of the residuals is ∼0.054 For comparison, the black filled triangles show similar residuals for the Aquila original image (cf. Fig. 6c).
Current usage metrics show cumulative count of Article Views (full-text article views including HTML views, PDF and ePub downloads, according to the available data) and Abstracts Views on Vision4Press platform.
Data correspond to usage on the plateform after 2015. The current usage metrics is available 48-96 hours after online publication and is updated daily on week days.
Initial download of the metrics may take a while.