Fig. 7.
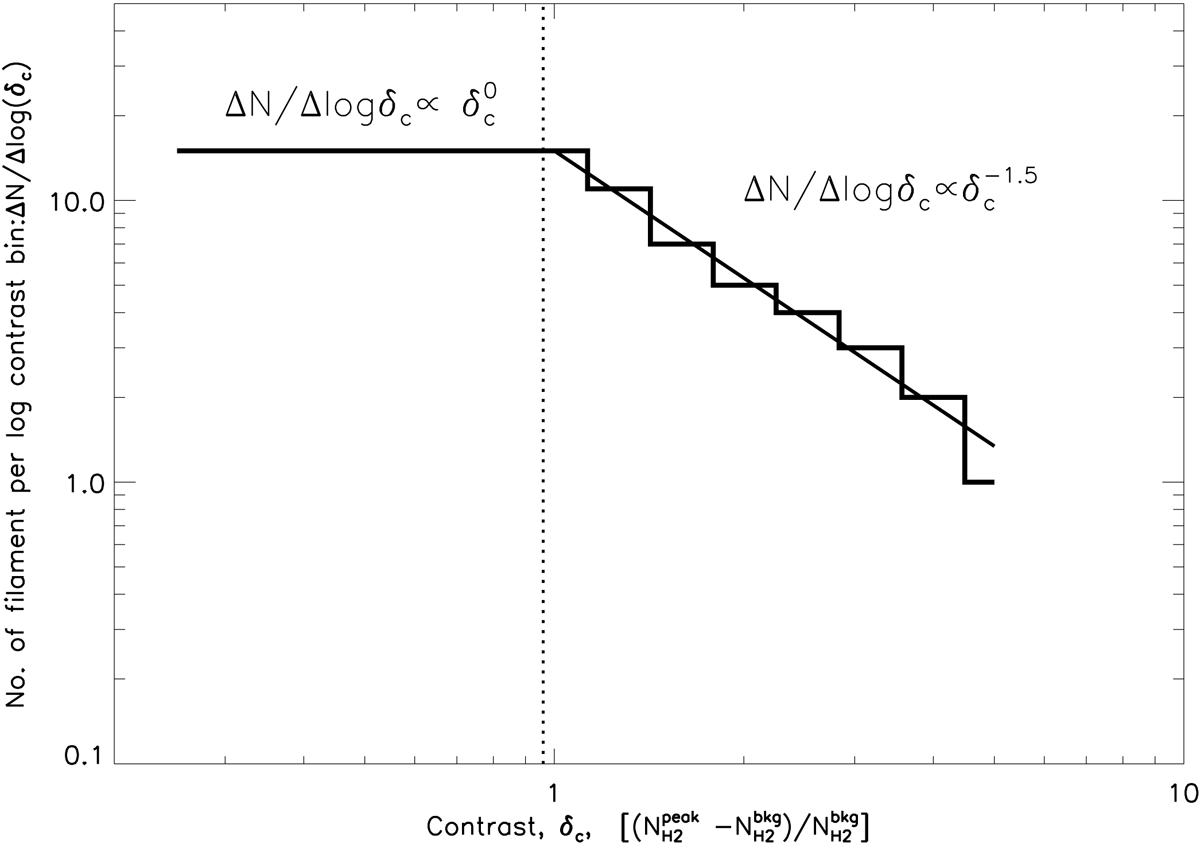
Two-segment power-law approximation (black solid lines) to the distribution of filament column density contrasts observed in the Aquila molecular cloud (Arzoumanian et al. 2019): dN/dlog(δc)∼const for 0.3 ≤ δc ≤ 1, and d![]() for 1 ≤ δc ≤ 4. The vertical dotted line marks the average filament contrast ⟨δc⟩∼1. The overplotted histogram shows the distribution of column density contrasts for the population of 100 synthetic filaments used in the simulation of Sect. 4.
for 1 ≤ δc ≤ 4. The vertical dotted line marks the average filament contrast ⟨δc⟩∼1. The overplotted histogram shows the distribution of column density contrasts for the population of 100 synthetic filaments used in the simulation of Sect. 4.
Current usage metrics show cumulative count of Article Views (full-text article views including HTML views, PDF and ePub downloads, according to the available data) and Abstracts Views on Vision4Press platform.
Data correspond to usage on the plateform after 2015. The current usage metrics is available 48-96 hours after online publication and is updated daily on week days.
Initial download of the metrics may take a while.