Fig. 6.
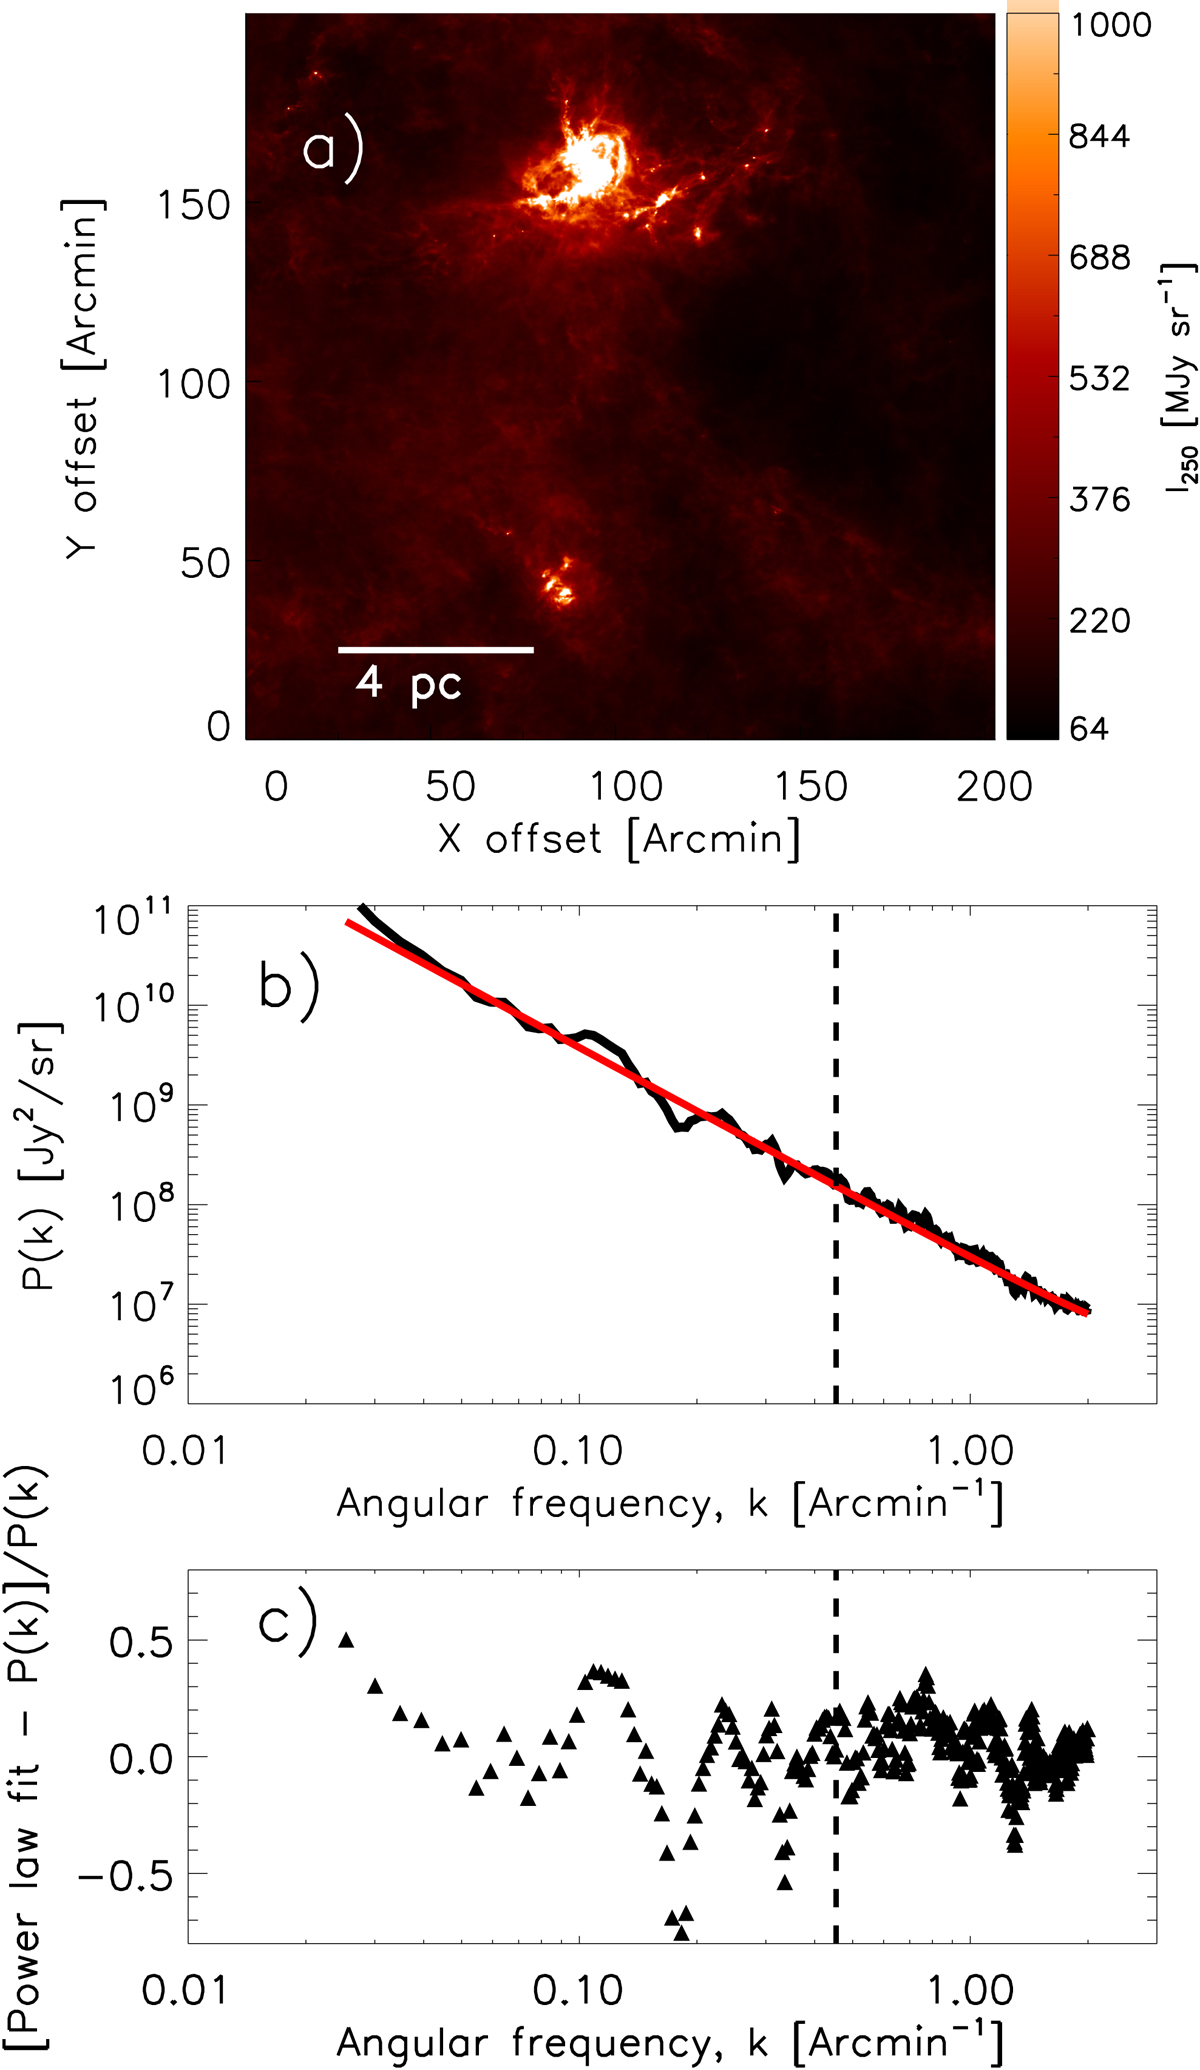
Panel a: Herschel/SPIRE 250 μm image of the Aquila cloud at the native resolution of 18![]() 2. Panel b: noise-subtracted and beam-corrected power spectrum of the image shown in panel a over the range of angular frequencies 0.025 arcmin−1 < k < 2 arcmin−1 (black curve). The red curve shows the best fit power-law model over this frequency range, which has a logarithmic slope γ = −2.26 ± 0.1. The vertical dashed line marks the angular frequency kfil ∼ (0.6/θfil − width)∼0.45 arcmin−1 corresponding to a filament width of θfil − width =79 ″ (FWHM), i.e., 0.1 pc at a distance of 260 pc. Panel c: residuals between the best power-law fit and the power spectrum data points (triangle symbols). The
2. Panel b: noise-subtracted and beam-corrected power spectrum of the image shown in panel a over the range of angular frequencies 0.025 arcmin−1 < k < 2 arcmin−1 (black curve). The red curve shows the best fit power-law model over this frequency range, which has a logarithmic slope γ = −2.26 ± 0.1. The vertical dashed line marks the angular frequency kfil ∼ (0.6/θfil − width)∼0.45 arcmin−1 corresponding to a filament width of θfil − width =79 ″ (FWHM), i.e., 0.1 pc at a distance of 260 pc. Panel c: residuals between the best power-law fit and the power spectrum data points (triangle symbols). The ![]() of the residuals between kmin < k < 1.5 kfil is ∼0.045.
of the residuals between kmin < k < 1.5 kfil is ∼0.045.
Current usage metrics show cumulative count of Article Views (full-text article views including HTML views, PDF and ePub downloads, according to the available data) and Abstracts Views on Vision4Press platform.
Data correspond to usage on the plateform after 2015. The current usage metrics is available 48-96 hours after online publication and is updated daily on week days.
Initial download of the metrics may take a while.