Fig. 2.
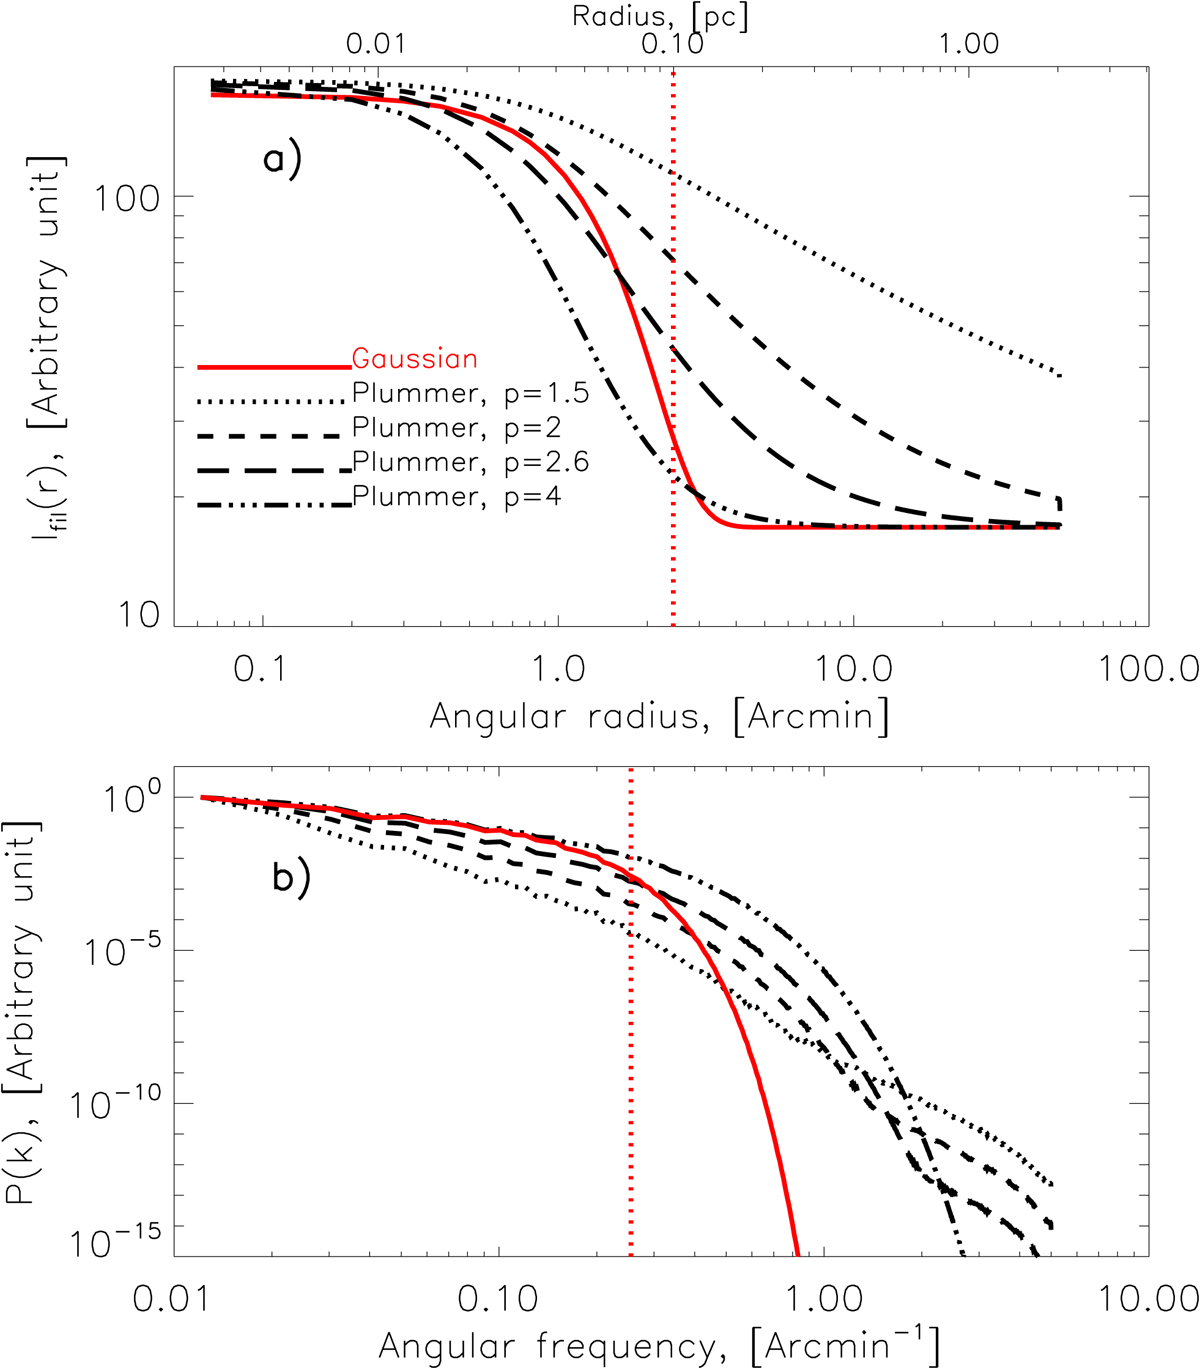
Transverse profiles of several simple model filaments (a) and corresponding power spectra (b). Panel a: red curve shows the Gaussian column density profile of the filament displayed in Fig. 1, which has a FWHM width of 0.1 pc at a distance of 140 pc. The red vertical line marks the FWHM of the Gaussian profile. The black dashed and dotted curves display Plummer-like filament profiles with Rflat ∼ 0.03 pc and logarithmic slopes p = 1.5, 2, 2.6, and 4. Panel b: all power spectra were normalized to 1 at the lowest angular frequency ![]() . The power spectra all decrease sharply at high angular frequencies, with the highest rate of decrease obtained for the Gaussian model (red curve). For the Plummer models, the rate of decrease is higher for higher p values. Note the kink near k = 0.8 arcmin−1 for the Plummer model with p = 1.5, which disappears for higher p values. The red vertical dashed line denotes scale Γfil = 0.24 arcmin−1.
. The power spectra all decrease sharply at high angular frequencies, with the highest rate of decrease obtained for the Gaussian model (red curve). For the Plummer models, the rate of decrease is higher for higher p values. Note the kink near k = 0.8 arcmin−1 for the Plummer model with p = 1.5, which disappears for higher p values. The red vertical dashed line denotes scale Γfil = 0.24 arcmin−1.
Current usage metrics show cumulative count of Article Views (full-text article views including HTML views, PDF and ePub downloads, according to the available data) and Abstracts Views on Vision4Press platform.
Data correspond to usage on the plateform after 2015. The current usage metrics is available 48-96 hours after online publication and is updated daily on week days.
Initial download of the metrics may take a while.