Fig. C.1.
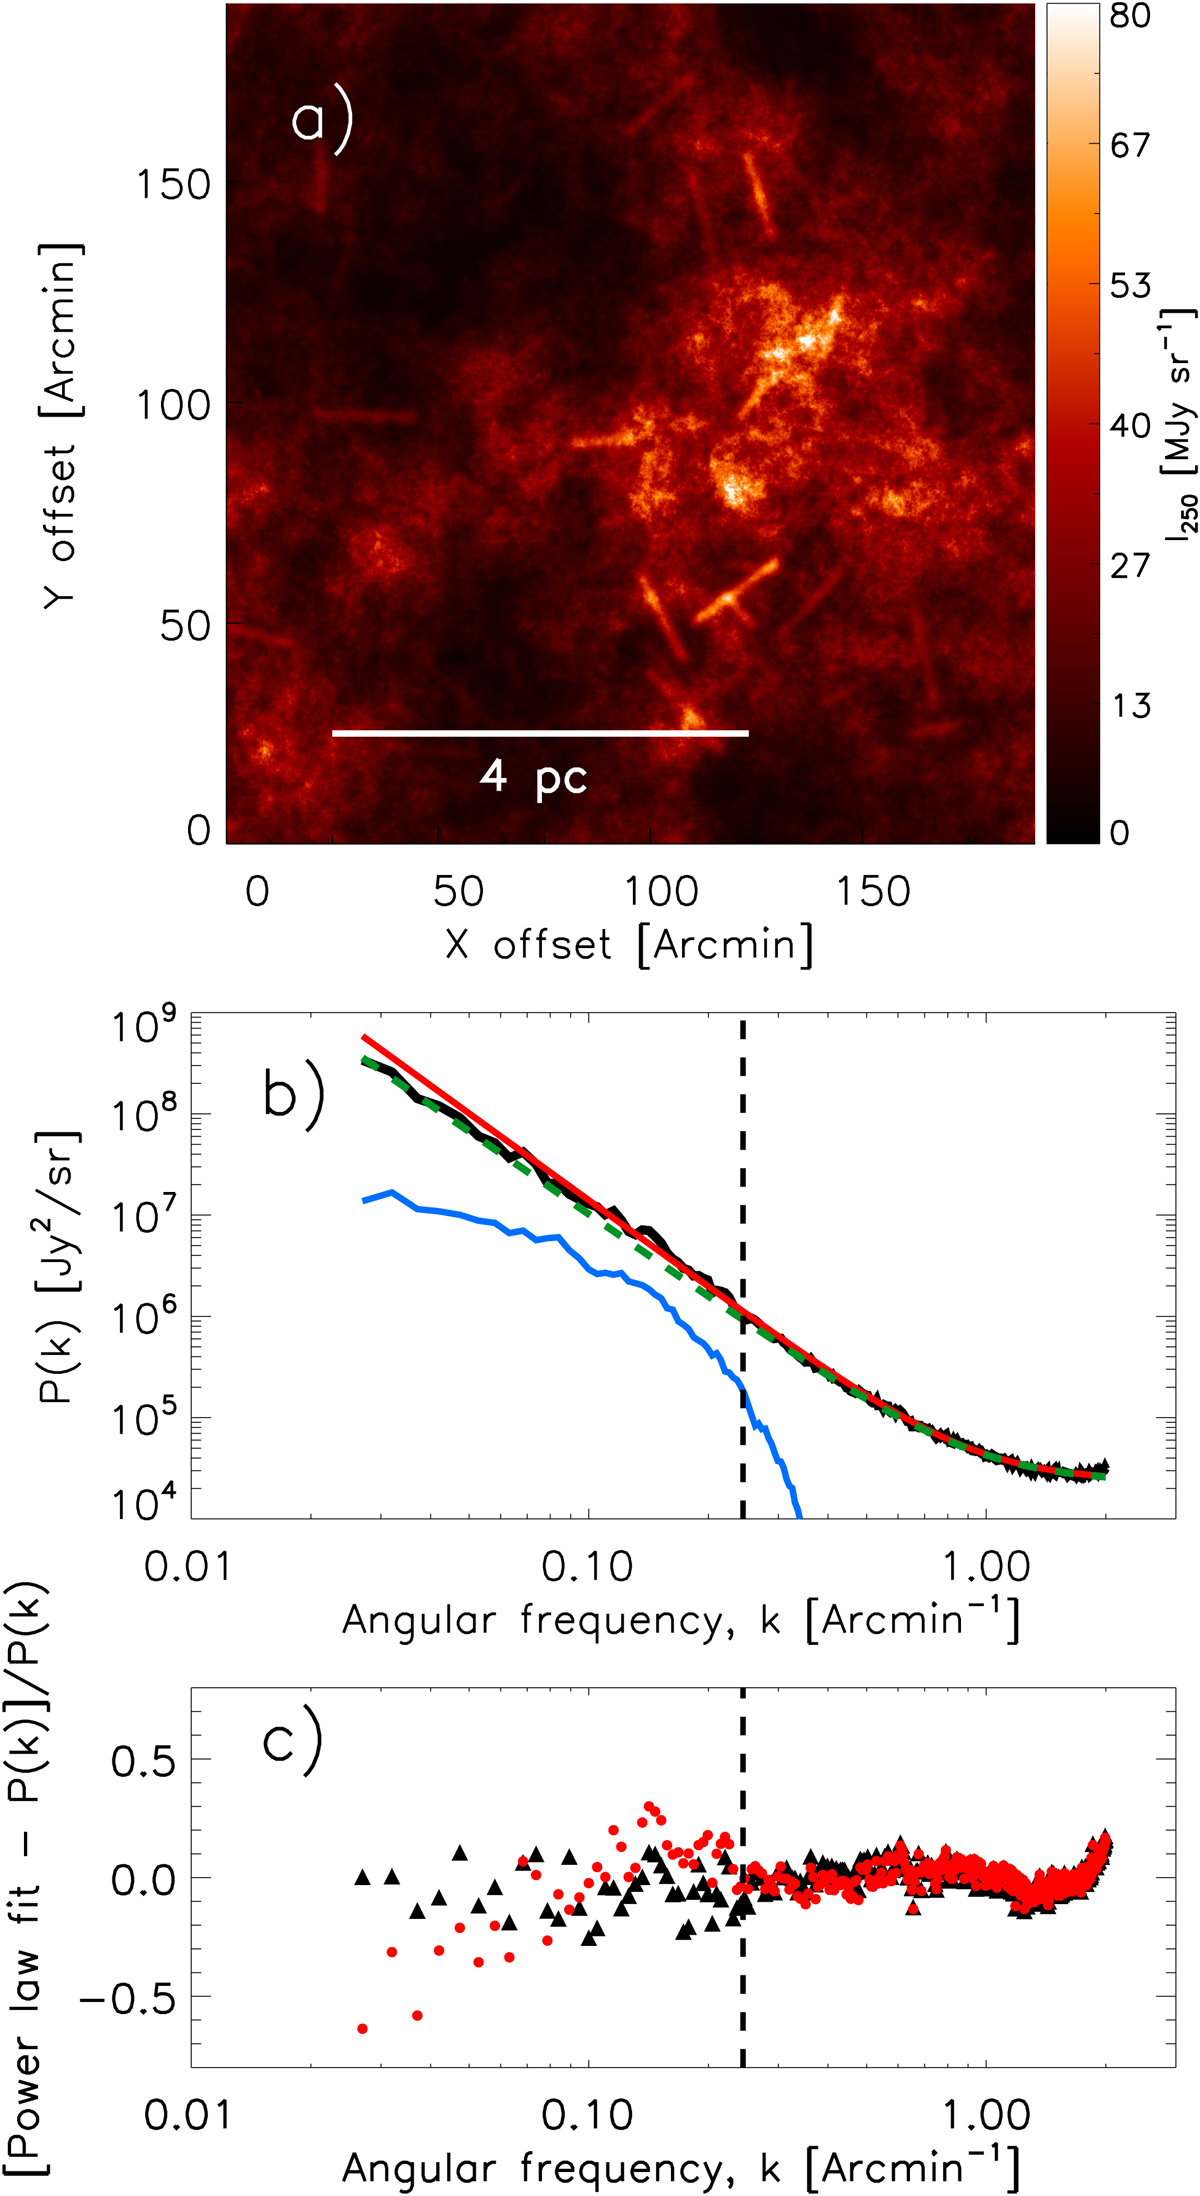
Purely synthetic image, made up of a scale-free background image constructed using the fBm algorithm (panel a; cf. Miville-Deschênes et al. 2003). The embedded synthetic filaments have a lognormal column density contrast distribution in a range between 0.3 < δc < 2 and peak of δpeak ∼ 0.9. The overall area-filling factor of the filaments is Afil ∼ 3%. The filaments are of Gaussian profiles with a FWHM ∼0.1 pc at a distance of 140 pc (see text). Panel b: solid black curve shows the power spectrum of the scale-free background image and the synthetic filaments. The logarithmic slope of the power-spectrum is γ ∼ −2.7 ± 0.1. The dashed curve shows the power spectrum of the background image (γ ∼ −2.8). The blue solid line shows the power spectrum of the synthetic filaments. Panel c: residuals between the best power-law fit and the power spectrum data points (triangle symbols) of synthetic cirrus map. The ![]() of the residuals between kmin < k < 1.5 kfil is 0.03.
of the residuals between kmin < k < 1.5 kfil is 0.03.
Current usage metrics show cumulative count of Article Views (full-text article views including HTML views, PDF and ePub downloads, according to the available data) and Abstracts Views on Vision4Press platform.
Data correspond to usage on the plateform after 2015. The current usage metrics is available 48-96 hours after online publication and is updated daily on week days.
Initial download of the metrics may take a while.