Fig. B.3.
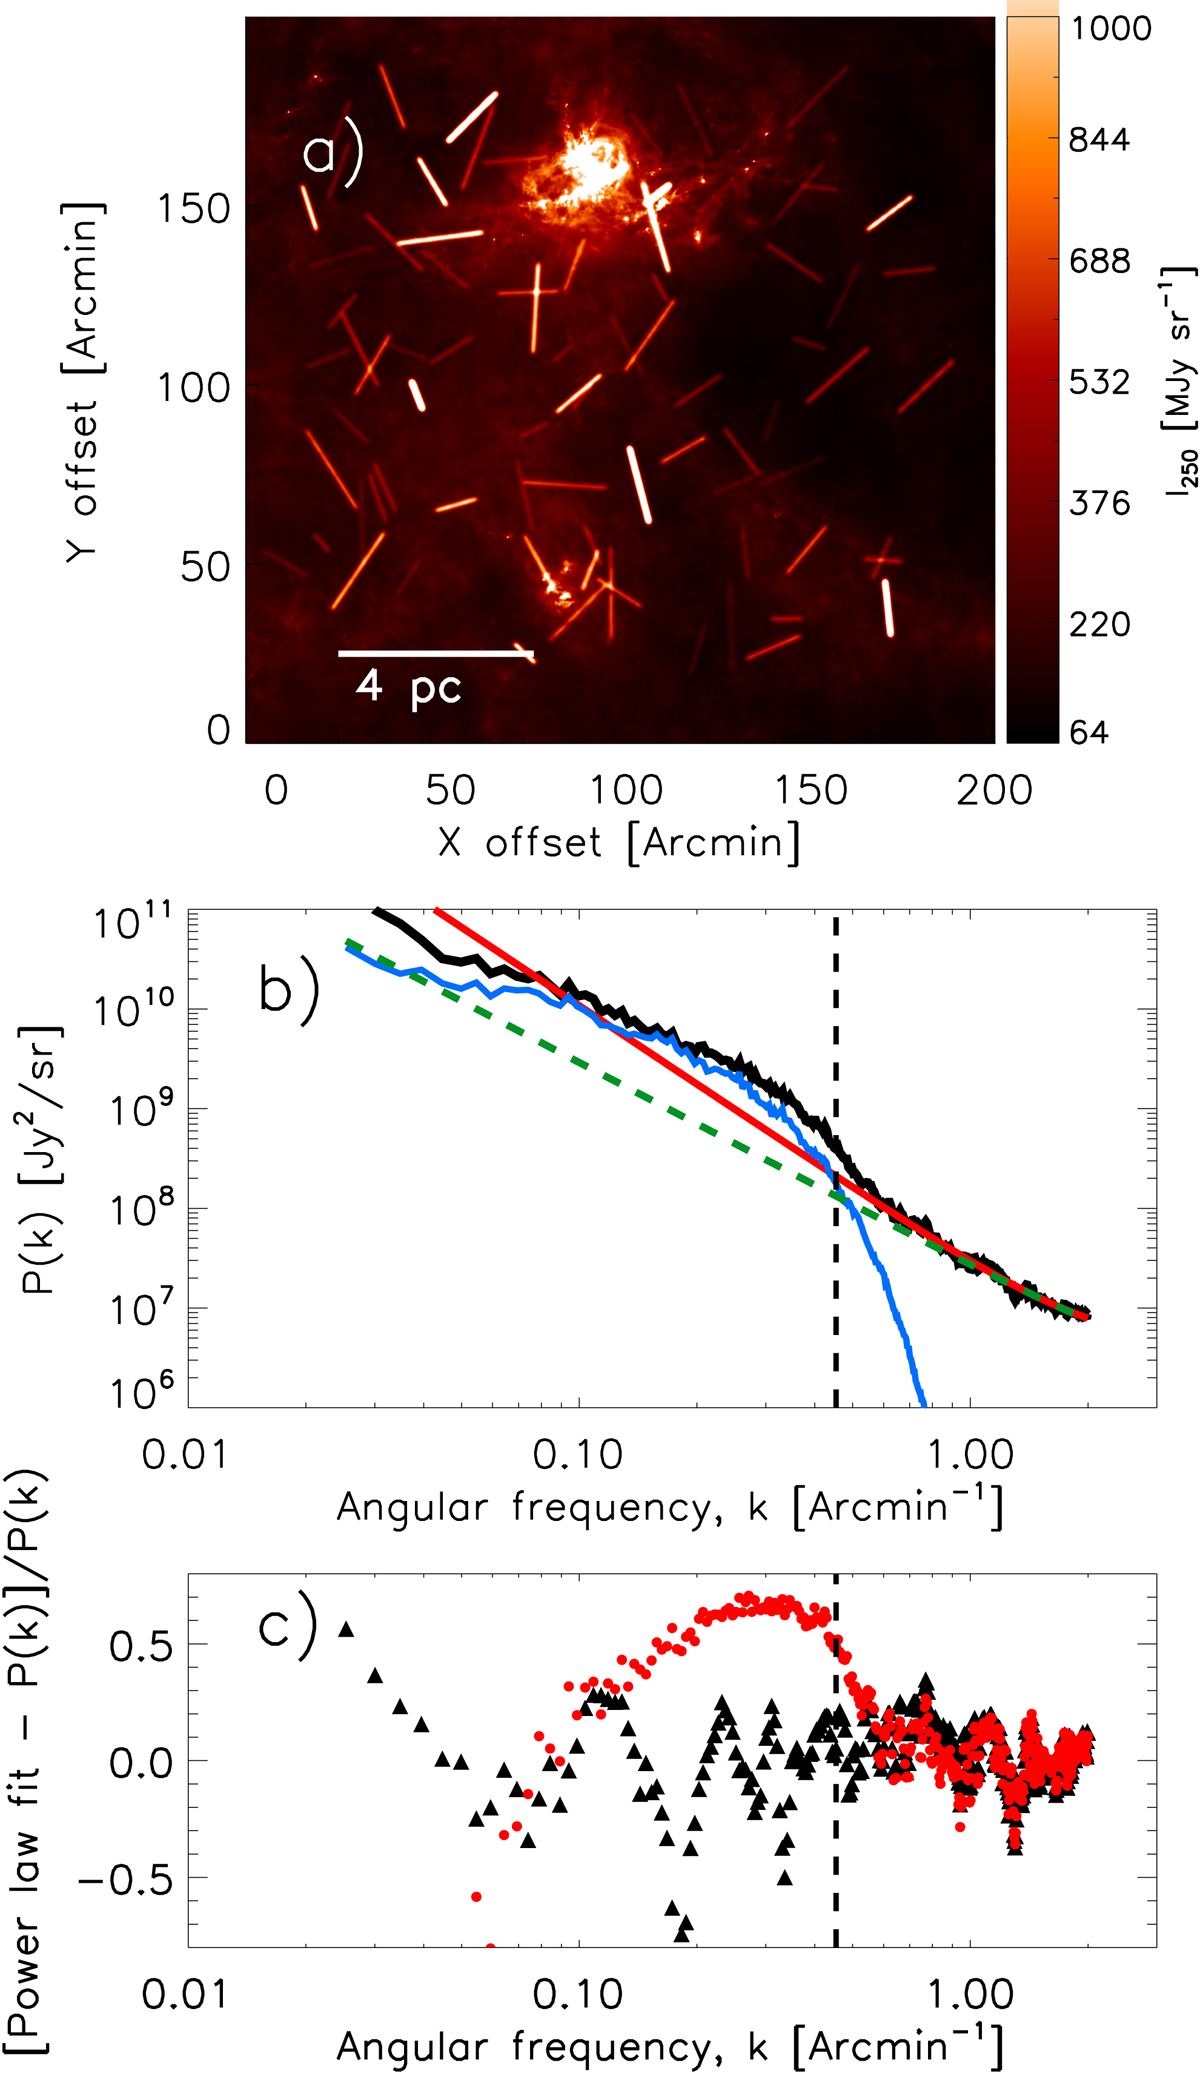
Same as Fig. 8 but for a population of synthetic filaments with a more extreme (and unrealistic) distribution of column density contrasts corresponding to ⟨δc⟩ ∼ 2.2 (see Fig. B.4) and an area filling factor Afil ∼ 5.5%, resulting in a combined parameter ![]() Afil ∼ 0.27. Panel b: note how the power spectrum arising from the synthetic filament population (blue curve) dominates over the power spectrum of the Aquila original image (see green dashed curve and Fig. 6). The logarithmic slope of the best power-law fit to the total power spectrum P(k)fil + P(k)Aquila is −2.6 (red line). Panel c: residuals between the best power-law fit and P(k)Aquila + fil (red solid circles) shows a peak near kfil, Aquila = 0.45 arcmin−1. For this simulation, the
Afil ∼ 0.27. Panel b: note how the power spectrum arising from the synthetic filament population (blue curve) dominates over the power spectrum of the Aquila original image (see green dashed curve and Fig. 6). The logarithmic slope of the best power-law fit to the total power spectrum P(k)fil + P(k)Aquila is −2.6 (red line). Panel c: residuals between the best power-law fit and P(k)Aquila + fil (red solid circles) shows a peak near kfil, Aquila = 0.45 arcmin−1. For this simulation, the ![]() of the residuals is 0.28.
of the residuals is 0.28.
Current usage metrics show cumulative count of Article Views (full-text article views including HTML views, PDF and ePub downloads, according to the available data) and Abstracts Views on Vision4Press platform.
Data correspond to usage on the plateform after 2015. The current usage metrics is available 48-96 hours after online publication and is updated daily on week days.
Initial download of the metrics may take a while.