Fig. B.2.
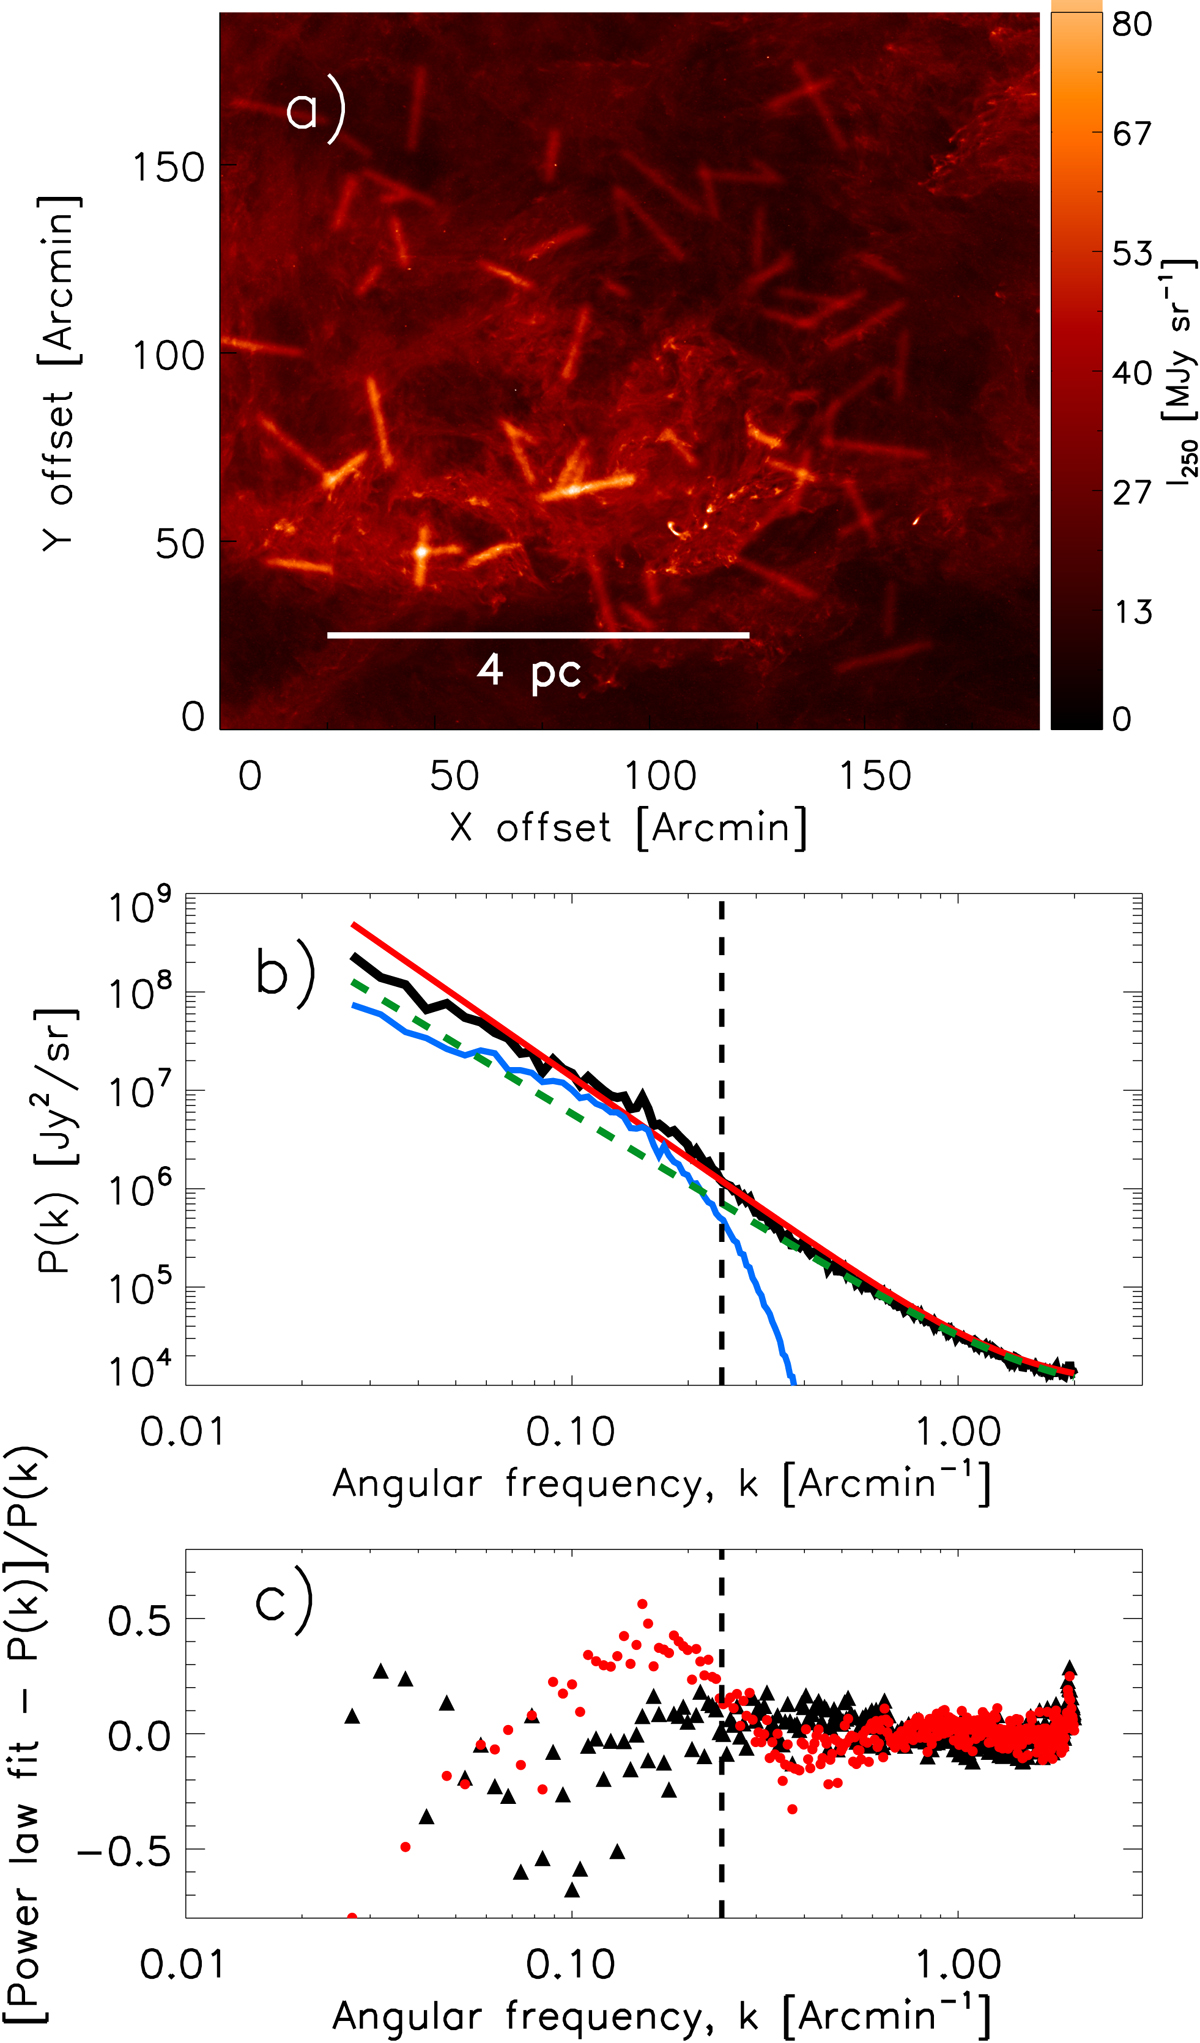
Same as Fig. 5 but for a population of synthetic filaments with higher column density contrasts δc ∼ 1.1, resulting in ![]() Afil ∼ 0.087. (The area filling factor is similar to that in Fig. 4, Afil ∼ 7.2%.) Panel b: note how the amplitude of the power spectrum due to the synthetic filaments (blue curve) is comparable to that of the power spectrum of the Polaris original image (see green dashed line and Fig. 3). The logarithmic slope of the total power spectrum P(k)fil + P(k)Polaris is −2.96. Panel c: residuals between the best power-law fit and P(k)Polaris + fil (red solid circles) shows a peak near kfil ∼ 0.24 arcmin−1. In this simulation, the
Afil ∼ 0.087. (The area filling factor is similar to that in Fig. 4, Afil ∼ 7.2%.) Panel b: note how the amplitude of the power spectrum due to the synthetic filaments (blue curve) is comparable to that of the power spectrum of the Polaris original image (see green dashed line and Fig. 3). The logarithmic slope of the total power spectrum P(k)fil + P(k)Polaris is −2.96. Panel c: residuals between the best power-law fit and P(k)Polaris + fil (red solid circles) shows a peak near kfil ∼ 0.24 arcmin−1. In this simulation, the ![]() is 0.08, close to the fiducial detection limit
is 0.08, close to the fiducial detection limit ![]() Afil ∼ 1 introduced in Sect. 7 (see Fig. 12).
Afil ∼ 1 introduced in Sect. 7 (see Fig. 12).
Current usage metrics show cumulative count of Article Views (full-text article views including HTML views, PDF and ePub downloads, according to the available data) and Abstracts Views on Vision4Press platform.
Data correspond to usage on the plateform after 2015. The current usage metrics is available 48-96 hours after online publication and is updated daily on week days.
Initial download of the metrics may take a while.