Fig. 12.
![]() of the residuals between the best power-law fit and the output power spectrum as a function of
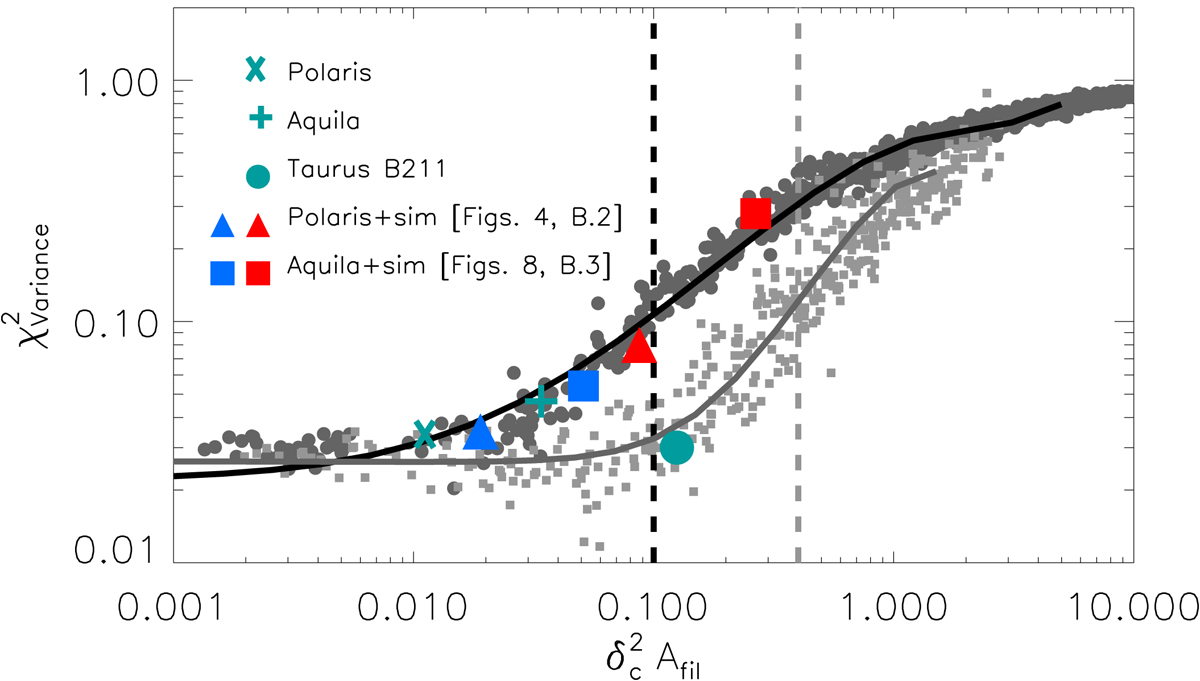
of the residuals between the best power-law fit and the output power spectrum as a function of ![]() Afil. The black solid circles represent the same set of simulations with Gaussian filaments as in Fig. 11. The light gray squares represent our set of simulations with Plummer-like (p = 2) filament profiles. The corresponding black and gray curves are polynomial fits to guide the eye. The black and gray vertical dashed lines mark the fiducial limits of
Afil. The black solid circles represent the same set of simulations with Gaussian filaments as in Fig. 11. The light gray squares represent our set of simulations with Plummer-like (p = 2) filament profiles. The corresponding black and gray curves are polynomial fits to guide the eye. The black and gray vertical dashed lines mark the fiducial limits of ![]() Afil ∼ 0.1 and
Afil ∼ 0.1 and ![]() Afil ∼ 0.4 above which Gaussian-shaped and Plummer-shaped filaments become detectable in the residual power spectrum plot, respectively. The green cross, plus, and solid circle symbols mark the positions of the Polaris, Aquila, and Taurus clouds, respectively, based on the comprehensive study of filament properties by Arzoumanian et al. (2019).
Afil ∼ 0.4 above which Gaussian-shaped and Plummer-shaped filaments become detectable in the residual power spectrum plot, respectively. The green cross, plus, and solid circle symbols mark the positions of the Polaris, Aquila, and Taurus clouds, respectively, based on the comprehensive study of filament properties by Arzoumanian et al. (2019).
Current usage metrics show cumulative count of Article Views (full-text article views including HTML views, PDF and ePub downloads, according to the available data) and Abstracts Views on Vision4Press platform.
Data correspond to usage on the plateform after 2015. The current usage metrics is available 48-96 hours after online publication and is updated daily on week days.
Initial download of the metrics may take a while.