Fig. 11.
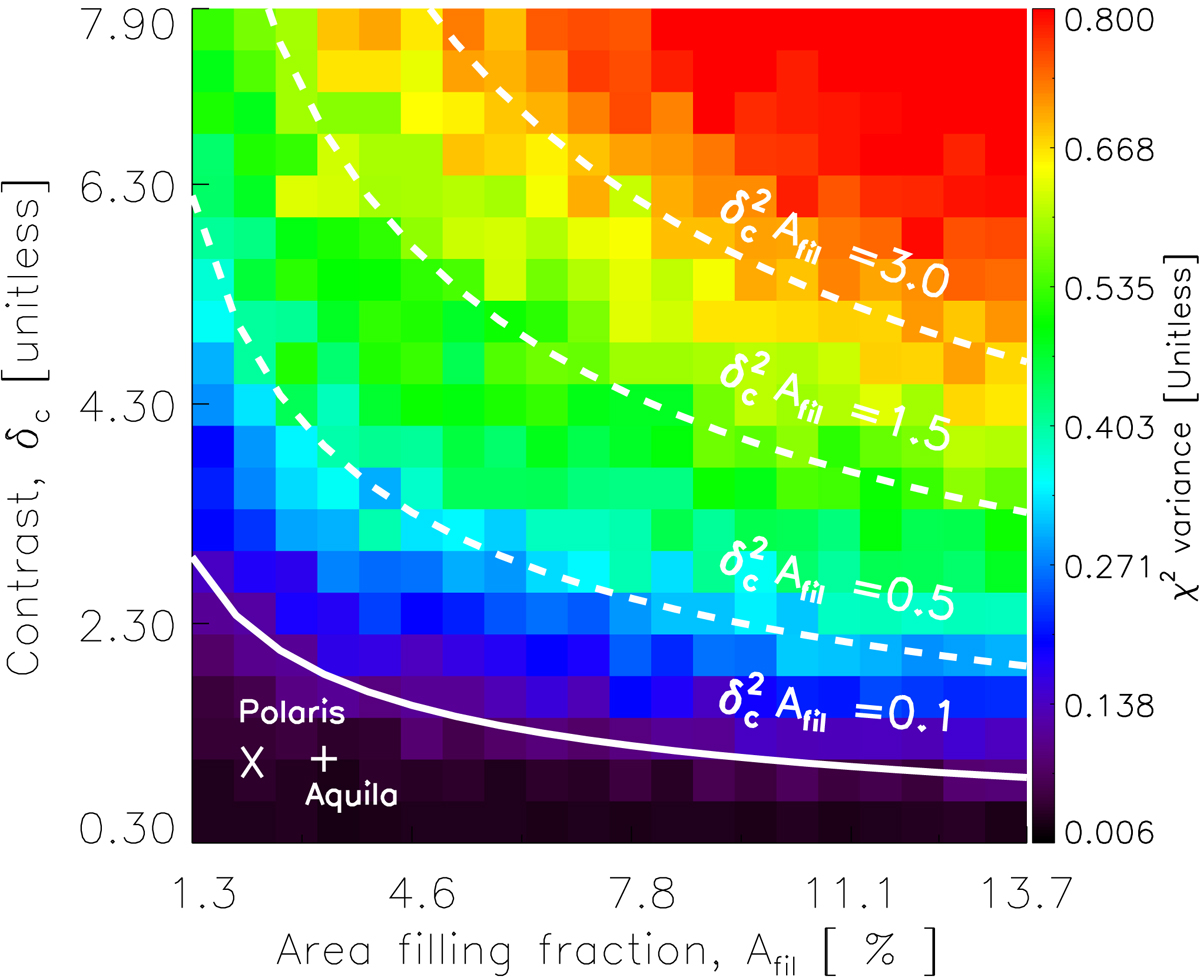
Map of the χ2− variance of the residuals between the best power-law fit and the output power spectrum as a function of column density contrast (δc) and area filling factor (Afil) in a grid of simulations based on a set of 20 × 20 populations of Gaussian synthetic filaments, all 0.1 pc in width (see text of Sect. 7 for details). The white solid curve marks the fiducial limit ![]() Afil = 0.1 above which the effect of the characteristic filament width can be detected in the power spectrum (see Fig. 12 below). The white plus and cross symbols mark the positions of the observed populations of filaments in the Aquila and Polaris clouds, respectively (cf. Arzoumanian et al. 2019).
Afil = 0.1 above which the effect of the characteristic filament width can be detected in the power spectrum (see Fig. 12 below). The white plus and cross symbols mark the positions of the observed populations of filaments in the Aquila and Polaris clouds, respectively (cf. Arzoumanian et al. 2019).
Current usage metrics show cumulative count of Article Views (full-text article views including HTML views, PDF and ePub downloads, according to the available data) and Abstracts Views on Vision4Press platform.
Data correspond to usage on the plateform after 2015. The current usage metrics is available 48-96 hours after online publication and is updated daily on week days.
Initial download of the metrics may take a while.